 |
 |
|
 |
|
 |
|  |
|  |
|
 |
|
 |
|  |
|  |
|
 |
With regard to the recent discussions about color_maps, I was wondering if it
were possible to somehow extract the number, or even the values of the entries
in a color_map.
I know that we cannot do this directly, but I was wondering if there were
perhaps a method by which a function could be applied which would reveal the
locations of the "nodes". Some discontinuity or eigenvector, or other clever
exploit.
Perhaps there's a way to look at some sort of plot of the rgb values and see
where the blending transitions from interpolating A into B over to where it
switches into interpolating B into C....
I'm also wondering if there is a color_map that exceeds the valid 0-1 span, if
it were possible to access those invalid entries using the same sort of hacking
strategy.
Post a reply to this message
|
 |
|  |
|  |
|
 |
|
 |
|  |
|  |
|
 |
"Bald Eagle" <cre### [at] netscape net> wrote:
> With regard to the recent discussions about color_maps, I was wondering if it
> were possible to somehow extract the number, or even the values of the entries
> in a color_map.
Apparently it was a lot easier than I thought.
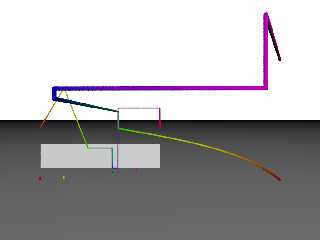
Here's a plot of the color map as it gets interpolated through HSV space.
The graph is one of the more successful (and simplest) of several functions I've
been inventing to look for "nodes" in the color_map definition.
> I'm also wondering if there is a color_map that exceeds the valid 0-1 span, if
> it were possible to access those invalid entries using the same sort of hacking
> strategy.
Unfortunately, I haven't brainstormed any way to do this part - that's probably
going to have to be a source-code level change.
- BW net> wrote:
> With regard to the recent discussions about color_maps, I was wondering if it
> were possible to somehow extract the number, or even the values of the entries
> in a color_map.
Apparently it was a lot easier than I thought.
Here's a plot of the color map as it gets interpolated through HSV space.
The graph is one of the more successful (and simplest) of several functions I've
been inventing to look for "nodes" in the color_map definition.
> I'm also wondering if there is a color_map that exceeds the valid 0-1 span, if
> it were possible to access those invalid entries using the same sort of hacking
> strategy.
Unfortunately, I haven't brainstormed any way to do this part - that's probably
going to have to be a source-code level change.
- BW
Post a reply to this message
Attachments:
Download 'colormapanalysis.png' (49 KB)
Preview of image 'colormapanalysis.png'

|
 |
|  |
|  |
|
 |
|
 |
|  |
|  |
|
 |
> Apparently it was a lot easier than I thought.
> Here's a plot of the color map as it gets interpolated through HSV space.
> The graph is one of the more successful (and simplest) of several functions I've
> been inventing to look for "nodes" in the color_map definition.
Colormap reverse engineering... Really non-standard question, interesting, what
practical aspect can be here ?
Could you please provide little more details about this graph and idea behind
this method ? Is it works already ?
--
YB
Post a reply to this message
|
 |
|  |
|  |
|
 |
|
 |
|  |
|  |
|
 |
"yesbird" <nomail@nomail> wrote:
> > Apparently it was a lot easier than I thought.
> > Here's a plot of the color map as it gets interpolated through HSV space.
> > The graph is one of the more successful (and simplest) of several functions I've
> > been inventing to look for "nodes" in the color_map definition.
>
> Colormap reverse engineering... Really non-standard question, interesting, what
> practical aspect can be here ?
> Could you please provide little more details about this graph and idea behind
> this method ? Is it works already ?
> --
> YB
Sure Sergey,
The out-of-range color_map that you started with led me experiment some more
with a color-pigment-texture map idea that I have had for a long time, and
explored further when working with Thomas deGroot on the Granite21 macro project
- something to guide the user seeing how the individual components of any map
contribute to the whole, and helping to fine-tune the finished texture.
Now, POV-Ray doesn't have very good read/write capability, and can only work
with comma separated value files (CSV), and we don't have a way to determine
what sort of data type is being read from a file.
So I had the idea of looking at an existing color map that could be incorporated
in the usual way "#include MyColorMap.inc" and then using some sort of algorithm
to extract the color_map entries. Then I could create an array, sort it, and do
any further processing that might be needed.
And yes, the analysis part is working - it just needs to be completely
automated, and then I can get on with the processing/editing/exporting parts.
I'm currently trying to write an algorithm to count the changes in slope on my
interpolation graph, and I really wish there was a way to either access
out-of-range color_map values, or to easily process an include file to scale the
index values to between 0 and 1.
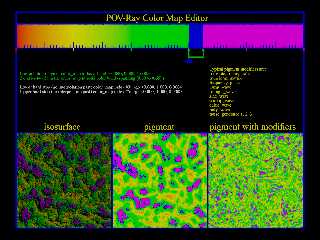
Here's a preview of the current state of the project:
Post a reply to this message
Attachments:
Download 'colormapeditor.png' (538 KB)
Preview of image 'colormapeditor.png'

|
 |
|  |
|  |
|
 |
|
 |
|  |
|  |
|
 |
> I'm currently trying to write an algorithm to count the changes in slope on my
> interpolation graph, and I really wish there was a way to either access
> out-of-range color_map values, or to easily process an include file to scale the
> index values to between 0 and 1.
Now I see, this is a serious research. IMHO, interpolation graph analysis may
become too complicated, as so many factors have influence.
Possible, text processing will be easier to implement, selecting good enough
instruments.
Good luck with it !
--
YB
Post a reply to this message
|
 |
|  |
|  |
|
 |
|
 |
|  |
|  |
|
 |
"yesbird" <nomail@nomail> wrote:
> Now I see, this is a serious research. IMHO, interpolation graph analysis may
> become too complicated, as so many factors have influence.
Well, I managed to get most of the color map entries detected and assembled into
a list, so it's at least a good proof of concept for this prototype tool.
Nodes = 7
Extracted Color Map = 7
[0.201 <0.995, 1.000, 0.000>]
[0.401 <0.000, 1.000, 0.000>]
[0.601 <0.000, 0.000, 1.000>]
[0.602 <0.000, 0.000, 1.000>]
[0.650 <1.000, 0.000, 1.000>]
[0.651 <1.000, 0.000, 1.000>]
[1.000 <1.000, 0.000, 0.000>]
Since my color-value graph has nice straight slopes, the Euclidean distance
between each loop step remains constant, and I just look for a change and then
add that to a dynamic array.
> Possible, text processing will be easier to implement, selecting good enough
> instruments.
It's always good to have multiple redundant paths to the same goal/solution.
- BW
Post a reply to this message
|
 |
|  |
|  |
|
 |
|
 |
|  |
|  |
|
 |
> Well, I managed to get most of the color map entries detected and assembled into
> a list, so it's at least a good proof of concept for this prototype tool.
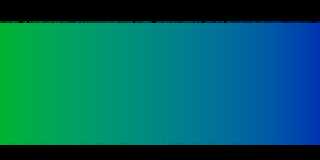
Looks good (attached), could you share original to compare ?
Post a reply to this message
Attachments:
Download 'example.png' (5 KB)
Preview of image 'example.png'

|
 |
|  |
|  |
|
 |
|
 |
|  |
|  |
|
 |
"yesbird" <nomail@nomail> wrote:
> > Well, I managed to get most of the color map entries detected and assembled into
> > a list, so it's at least a good proof of concept for this prototype tool.
>
> Looks good (attached), could you share original to compare ?
The original is the one in the color map editor. I'm missing 1 or 2 entries, so
it doesn't exactly replicate it. I got it to recognize some of the points
accurately and automatically, and then I needed to get some sleep. But I
wanted to get at least _some_ successful result before stopping.
Post a reply to this message
|
 |
|  |
|  |
|
 |
|
 |
|  |
|  |
|
 |
But I
> But I wanted to get at least _some_ successful result before stopping.
Like me, usually :)
I always like to play with colors, this is the reason why I am so interested in
colormap techniques and your research. But opposite to you I am going 'forward'
and found some interesting materials about colormap generation and supplemental
software.
https://www.kennethmoreland.com/color-advice/
https://github.com/marlam/gencolormap-mirror
Btw, I have access to ACM digital library (https://dl.acm.org/) and can fetch
any paper from there, by your desire.
--
YB
Post a reply to this message
|
 |
|  |
|  |
|
 |
From: William F Pokorny
Subject: Re: Extracting information from an existing color_map
Date: 18 Feb 2023 06:27:40
Message: <63f0b62c$1@news.povray.org>
|
|
 |
|  |
|  |
|
 |
On 2/15/23 14:52, Bald Eagle wrote:
> With regard to the recent discussions about color_maps, I was wondering if it
> were possible to somehow extract the number, or even the values of the entries
> in a color_map.
>
> I know that we cannot do this directly, but I was wondering if there were
> perhaps a method by which a function could be applied which would reveal the
> locations of the "nodes". Some discontinuity or eigenvector, or other clever
> exploit.
>
> Perhaps there's a way to look at some sort of plot of the rgb values and see
> where the blending transitions from interpolating A into B over to where it
> switches into interpolating B into C....
>
> I'm also wondering if there is a color_map that exceeds the valid 0-1 span, if
> it were possible to access those invalid entries using the same sort of hacking
> strategy.
>
Hi Bill,
I'm not keeping up well with this thread, but I have a couple thoughts.
---
Remember v3.8 supports color_map blend_mode and blend_gamma modifiers
which are internal to the color_map definition. These can skew the
overall color_map behavior.
#declare ColorMap01 = color_map {
blend_mode 3 blend_gamma 2.5
[0.000000 ...]
...
}
---
On accessing color_map values out of 'accessible' range(a) we need
updated POV-Ray source. This has been implemented in my povr fork and
was discussed back in 2019 here (though you completely hijacked the
thread for another useful bug/fix :-) ):
http://news.povray.org/povray.beta-test.binaries/thread/%3C5dab3f55%241%40news.povray.org%3E/
or
Message: <5dab3f55$1@news.povray.org>
Aside: The web hidden http://news.povray.org/povray.beta-test.binaries/
has other, older, povr fork and v4.0 idea related posts. For a time I
was trying not to confuse web news readers with povr things by using a
group visible only via a tool like Thunderbird. On the git master branch
becoming the v4.0 one in 2021, I started posting ideas in the v4.0 forum.
Bill P.
(a) As you know, the *_map mechanism in POV-Ray itself has long
supported key/index values well outside the [0-1] range, but we cannot
make use of this in any official POV-Ray release due other internal
limitations.
Post a reply to this message
|
 |
|  |
|  |
|
 |
|
 |
|  |


![]()