|
|
|
|
|
|
| |
| |
|
|
|
|
| |
| |
|
|
I've got a list of events and the dates when they happened. Any idea how
to get Excel to plot these events in a chart?
Post a reply to this message
|
|
| |
| |
|
|
|
|
| |
| |
|
|
Invisible wrote:
> I've got a list of events and the dates when they happened. Any idea how
> to get Excel to plot these events in a chart?
It turns out that if you have the labels in column A and the dates in
column B and you do an XY Scatter Plot, and turn on data labels, it does
sort-of the right thing.
However, nothing in hell will convince it to put the dates on the X
axis. If you put the data that way round, it spazzes out and doesn't
know how to plot the data any more. So I'm stuck with the dates on the Y
axis. *sigh*
(You also have to manually sort by date if you want a decent plot. It's
also fun trying to get the labels to not overlap...)
Post a reply to this message
|
|
| |
| |
|
|
|
|
| |
| |
|
|
> It turns out that if you have the labels in column A and the dates in
> column B and you do an XY Scatter Plot, and turn on data labels, it does
> sort-of the right thing.
>
> However, nothing in hell will convince it to put the dates on the X axis.
> If you put the data that way round, it spazzes out and doesn't know how to
> plot the data any more. So I'm stuck with the dates on the Y axis. *sigh*
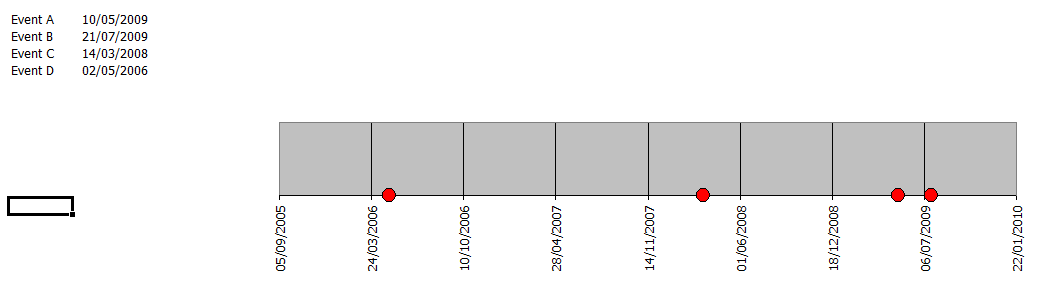
You can do an XY plot and set the X axis manually to be your date column,
you then get the attached. Is that what you want?
Post a reply to this message
Attachments:
Download 'image1.png' (8 KB)
Preview of image 'image1.png'
|
|
| |
| |
|
|
|
|
| |
| |
|
|
Invisible <voi### [at] dev null> wrote:
> I've got a list of events and the dates when they happened. Any idea how
> to get Excel to plot these events in a chart?
I once made some Gannt charts in 123 by making stacked bar charts. The first
stack plotted the start date, and I made that invisible (white). The second one
was the end date. I think I also had to play around with the date format-- like
type in 5-digit integers in the spreadsheet to get the date I wanted to show up
on the chart in date format. null> wrote:
> I've got a list of events and the dates when they happened. Any idea how
> to get Excel to plot these events in a chart?
I once made some Gannt charts in 123 by making stacked bar charts. The first
stack plotted the start date, and I made that invisible (white). The second one
was the end date. I think I also had to play around with the date format-- like
type in 5-digit integers in the spreadsheet to get the date I wanted to show up
on the chart in date format.
Post a reply to this message
|
|
| |
| |
|
|
|
|
| |
| |
|
|
>> It turns out that if you have the labels in column A and the dates in
>> column B and you do an XY Scatter Plot, and turn on data labels, it
>> does sort-of the right thing.
>>
>> However, nothing in hell will convince it to put the dates on the X
>> axis. If you put the data that way round, it spazzes out and doesn't
>> know how to plot the data any more. So I'm stuck with the dates on the
>> Y axis. *sigh*
>
> You can do an XY plot and set the X axis manually to be your date
> column, you then get the attached. Is that what you want?
That's more or less what I want. (But with the names of the events on
the dots.)
Post a reply to this message
|
|
| |
| |
|
|
|
|
| |
| |
|
|
gregjohn wrote:
> I once made some Gannt charts in 123 by making stacked bar charts. The first
> stack plotted the start date, and I made that invisible (white). The second one
> was the end date. I think I also had to play around with the date format-- like
> type in 5-digit integers in the spreadsheet to get the date I wanted to show up
> on the chart in date format.
Yeah, I thought about a bar chart. I hadn't thought of using invisible
bars in front though...
Post a reply to this message
|
|
| |
| |
|
|
|
|
| |
| |
|
|
> That's more or less what I want. (But with the names of the events on the
> dots.)
Hmm I don't know how or if it's possible to set that up automatically. How
many data points is it?
You can tell Excel to add a label to each data-point, but it seems to want
to convert each Y value to a number before displaying it (so text all comes
out as zero). Unless your events are numbered you will need to edit each
label text and link it back to the text cell. You could probably write a
short VB script to do this to all data points if you've got more than 10 or
so to do.
Post a reply to this message
|
|
| |
| |
|
|
|
|
| |
| |
|
|
"gregjohn" <pte### [at] yahoocom> wrote:
> The second one
> was the end date.
Second one was length of activity in days, if it matters.
Post a reply to this message
|
|
| |
| |
|
|
|
|
| |
| |
|
|
>> That's more or less what I want. (But with the names of the events on
>> the dots.)
>
> Hmm I don't know how or if it's possible to set that up automatically.
> How many data points is it?
About two-dozen.
> You can tell Excel to add a label to each data-point, but it seems to
> want to convert each Y value to a number before displaying it (so text
> all comes out as zero).
Exactly.
If you have the dates as the Y axis, it works for some reason, but if
you try to set it as the X axis... it fails.
> Unless your events are numbered you will need
> to edit each label text and link it back to the text cell. You could
> probably write a short VB script to do this to all data points if you've
> got more than 10 or so to do.
You know what? I think I'll use GNUplot. It'll probably be 80% faster...
Post a reply to this message
|
|
| |
| |
|
|
|
|
| |
| |
|
|
>> You can tell Excel to add a label to each data-point, but it seems to
>> want to convert each Y value to a number before displaying it (so text
>> all comes out as zero).
>
> Exactly.
>
> If you have the dates as the Y axis, it works for some reason, but if you
> try to set it as the X axis... it fails.
Yeh it seems to work easily the other way, this is because on the X axis the
graph can take a list of non-numerical data, or numerical values. For the Y
axis you must have numerical values, a list of text won't work.
You can always just do it the other way round and then rotate 90 degrees :-)
I suspect MS deliberately left it like this so you'd have to buy MS
Project...
Post a reply to this message
|
|
| |
| |
|
|
|
|
| |