|
 |
"Kenneth" <kdw### [at] gmail com> wrote:
> This is really cool. I especially like the idea of being able to choose the
> degree of roughness/fineness of the discretising. Nice work, and good
> conceptualizing.
Thanks! :)
It seems I re-invented HSV and came up with my own way of representing it from
scratch. :|
I was extremely happy when that first histogram popped up after I had enough
"Ohhhhh!...." debugging epiphanies. :D
> Am I guessing correctly that the 'hexagon' shape is actually a 3-D volumetric
> cube? Or just flat? If 3-D, then I can visualize what you mean by the grays and
> whites being "pushed to the rear" of the cube. That would make sense visually--
> the 'center point' of the 2-D hexagon (or 'front corner' of the cube)
> representing pure black, and the 'rear corner' of the cube representing pure
> white.
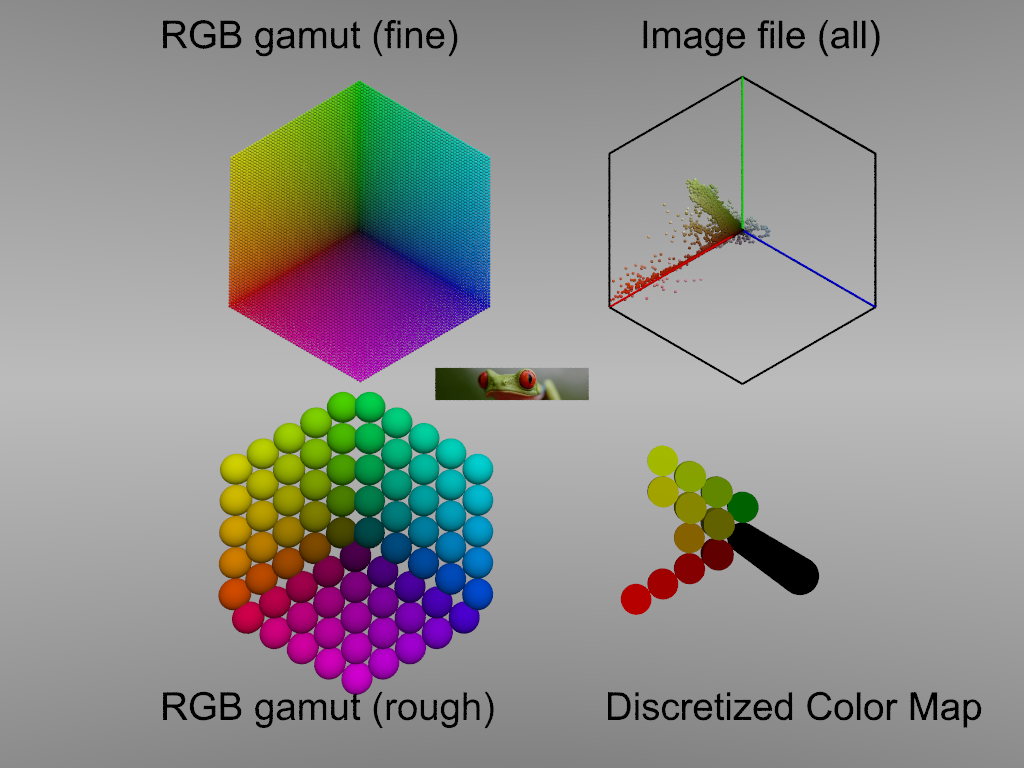
The hexagons are 3 parallelograms fitted together - I hadn't figured out how to
do the whole gamut in one go. All flat, z=0.
The color values sampled from the picture have the z value determined by some
modification of R+G+B. Black is toward the camera, whites and grays and lighter
color shades toward the rear.
My immediate goal was to home in on the major contributing hues of the image,
since I think it's easier for a user (me) to lighten/darken a color rather than
try to adjust the hue with some unknown amount of R, G, or B.
It's very difficult for me to ... accept ... my rendered procedural
pigments/textures as being accurate representations of the original color -
probably because there is so much other information in the subtle shading and
textural variations of something real, that my brain doesn't like the
approximation I come up with. (Even though a uv-mapped version using a cropped
section of the original photo looks nearly identical)
Perhaps I could find a way to measure the range of saturation of each discrete
area, and vary the shading of the histogram cylinders to suggest that variation.
Not sure how else I'd be able to jam that much info into one 3D space that's
fully visible to the camera. com> wrote:
> This is really cool. I especially like the idea of being able to choose the
> degree of roughness/fineness of the discretising. Nice work, and good
> conceptualizing.
Thanks! :)
It seems I re-invented HSV and came up with my own way of representing it from
scratch. :|
I was extremely happy when that first histogram popped up after I had enough
"Ohhhhh!...." debugging epiphanies. :D
> Am I guessing correctly that the 'hexagon' shape is actually a 3-D volumetric
> cube? Or just flat? If 3-D, then I can visualize what you mean by the grays and
> whites being "pushed to the rear" of the cube. That would make sense visually--
> the 'center point' of the 2-D hexagon (or 'front corner' of the cube)
> representing pure black, and the 'rear corner' of the cube representing pure
> white.
The hexagons are 3 parallelograms fitted together - I hadn't figured out how to
do the whole gamut in one go. All flat, z=0.
The color values sampled from the picture have the z value determined by some
modification of R+G+B. Black is toward the camera, whites and grays and lighter
color shades toward the rear.
My immediate goal was to home in on the major contributing hues of the image,
since I think it's easier for a user (me) to lighten/darken a color rather than
try to adjust the hue with some unknown amount of R, G, or B.
It's very difficult for me to ... accept ... my rendered procedural
pigments/textures as being accurate representations of the original color -
probably because there is so much other information in the subtle shading and
textural variations of something real, that my brain doesn't like the
approximation I come up with. (Even though a uv-mapped version using a cropped
section of the original photo looks nearly identical)
Perhaps I could find a way to measure the range of saturation of each discrete
area, and vary the shading of the histogram cylinders to suggest that variation.
Not sure how else I'd be able to jam that much info into one 3D space that's
fully visible to the camera.
Post a reply to this message
|
|
|
|
"Bald Eagle" <cre### [at] netscapenet> wrote:
> "Bald Eagle" <cre### [at] netscapenet> wrote:
> > Another run: :)
>
> Grr... Windows drives me insane sometimes.
I know the feeling!! (see my recent *erroneous* post about what I thought was a
problem in POV's v3.7.1 beta 4.)
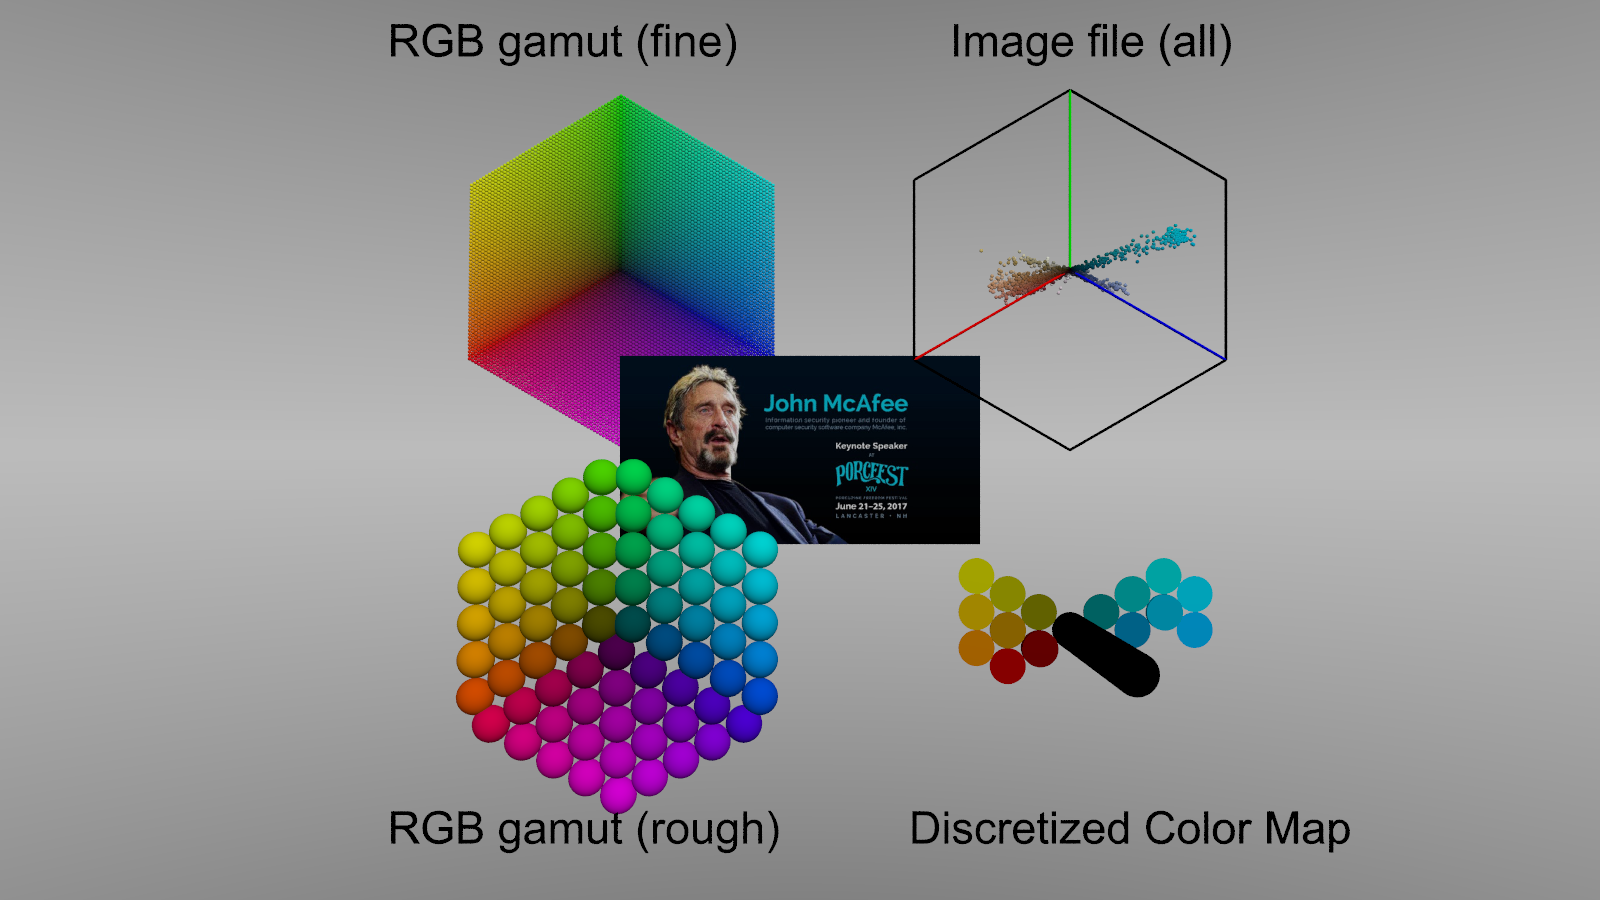
Your second image (with the mostly-black business card example) clarified
something for me. I originally thought that your upper-right color histogram was
supposed to be showing not only the color components of the example, but the
*amount* of each color as well. (I.e., I was wondering why the amount of pure
black occupied such a tiny area at the center apex of the histogram.) But I
think I see now that the histogram only represents the colors themselves, not
the color amounts.
I was thinking: To show the amount of each color, perhaps your lower-right
discretised view of the colors could be composed of actual 3-D cylinders-- the
longer the cylinder, the more of that color in the example being worked with.
(The 'black cylinder' there looks kind of 3-D anyway-- jutting out in -z -- so
perhaps you've already thought of this. The other colors don't show that(?), at
least as far as I can tell. Perhaps exaggerating the 'length' of all the color
cylinders there might help, in that regard.) Anyway, just an idea.
Post a reply to this message
|
|
|
|
"Kenneth" <kdw### [at] gmailcom> wrote:
> I originally thought that your upper-right color histogram was
> supposed to be showing not only the color components of the example, but the
> *amount* of each color as well.
The upper right plot is just a straight 1:1 plotting of the color values from
the evalpigment function. The variable Step determines how densely the image is
sampled (to reduce time for large images)
> (I.e., I was wondering why the amount of pure
> black occupied such a tiny area at the center apex of the histogram.) But I
> think I see now that the histogram only represents the colors themselves, not
> the color amounts.
> I was thinking: To show the amount of each color, perhaps your lower-right
> discretised view of the colors could be composed of actual 3-D cylinders-- the
> longer the cylinder, the more of that color in the example being worked with.
> (The 'black cylinder' there looks kind of 3-D anyway-- jutting out in -z -- so
> perhaps you've already thought of this. The other colors don't show that(?), at
> least as far as I can tell. Perhaps exaggerating the 'length' of all the color
> cylinders there might help, in that regard.) Anyway, just an idea.
The _lower_ right "plot" IS exactly that - and that's one of the interesting
things that this sort of analysis shows - just how much white/gray/black
contributes to "color" images.
Look at the debug stream output from the message pane:
[Top Left] - Plotting Finely discretized RGB gamut with 125000 spheres
[Bottom Left] - Plotting Roughly Discretized RGB gamut with 75 spheres
Image file dimensions: 600 x 314
Reading 1 out of every 5 color values from 188400 pixels in image file...
[Top Right] - Plotting Full RGB gamut of image file in hexagonal grid...
[Bottom Right] - Displaying roughly discretized (averaged) colors of image
file...
Calculated Color Map:
Average RGB = <0.00, 0.00, 0.00> | Level: 241
Average RGB = <0.20, 0.00, 0.00> | Level: 155
Average RGB = <0.40, 0.00, 0.00> | Level: 20
Average RGB = <0.20, 0.20, 0.00> | Level: 11
Average RGB = <0.40, 0.20, 0.00> | Level: 44
Average RGB = <0.60, 0.20, 0.00> | Level: 15
Average RGB = <0.40, 0.40, 0.00> | Level: 5
Average RGB = <0.60, 0.40, 0.00> | Level: 12
Average RGB = <0.60, 0.60, 0.00> | Level: 1
Average RGB = <0.00, 0.00, 0.00> | Level: 4541
Average RGB = <0.00, 0.00, 0.20> | Level: 21
Average RGB = <0.00, 0.20, 0.20> | Level: 25
Average RGB = <0.00, 0.20, 0.40> | Level: 20
Average RGB = <0.00, 0.40, 0.40> | Level: 17
Average RGB = <0.00, 0.40, 0.60> | Level: 93
Average RGB = <0.00, 0.40, 0.80> | Level: 2
Average RGB = <0.00, 0.60, 0.60> | Level: 4
Average RGB = <0.00, 0.60, 0.80> | Level: 1
Average RGB = <0.00, 0.00, 0.00> | Level: 108
Average RGB = <0.20, 0.00, 0.00> | Level: 2
That's like 200 times as many black pixels as anything else.
I'll probably add another ceiling threshold to remove the very large values, or
just scale them down to that value so that everything else won't get squashed
down so much.
The whole histogram is unioned in the code and then rotated -x*90 to make it
"face out" - it could be rotated -45 or 0 degrees to give something more
obviously 3D, but for testing I didn't want to obscure too many color values
from the camera.
The most frequently occurring color value determines the size of the "Maximum"
variables, and then the whole 3D cylinder histogram gets scaled down based on
that. So, the proportions of colors ought to be "to scale"
Unless of course I screwed something up in the calculations and things are
getting out of whack between top right and bottom right.
Post a reply to this message
|
|