|
 |
Something popped into my head recently, and now I am trying to write an equation
for the cumulative distribution function of a probability density function using
sum ().
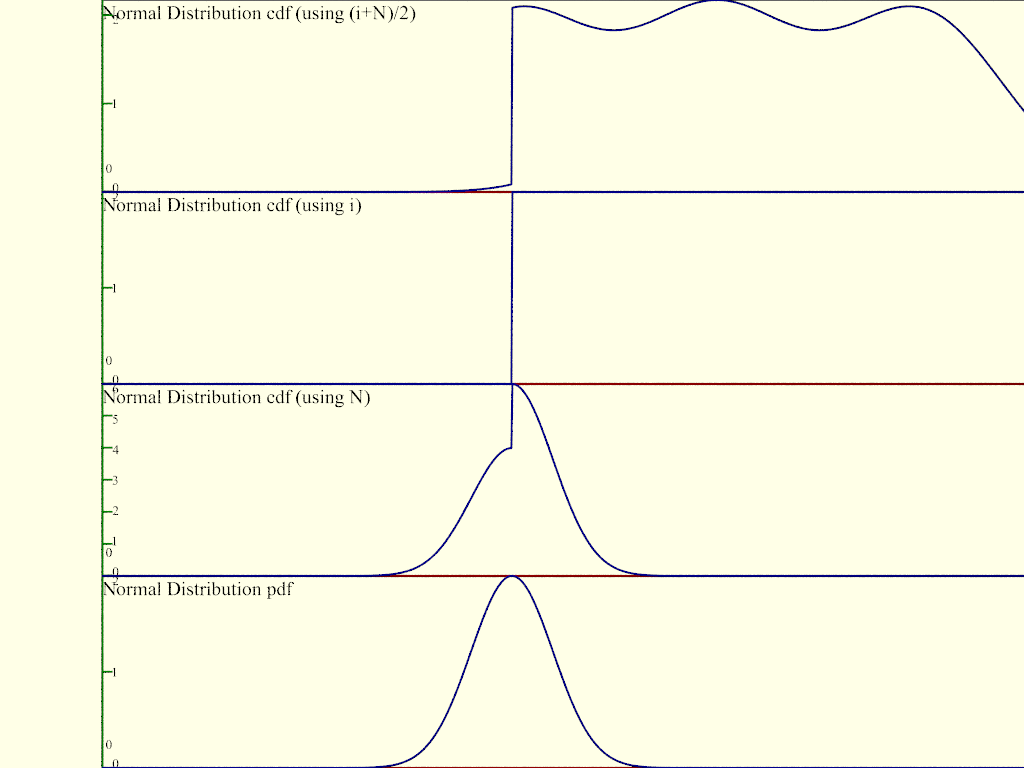
I'm using a normal distribution, but when I try to graph the summation of the
values over the range of 0 through 5, I get unexpected results.
I tried using N, then since i is related to N, I tried seeing what that result
looked like, and then I averaged them... It makes no sense that a graph of a
running tally starts to decrease, instead of being non-decreasing and
right-continuous like it should be.
#declare NDist = function (N, mu, sigma)
{1/(sigma*sqrt(tau))*exp(-0.5*pow((N-mu)/sigma,2))}
#declare NDist_cdf = function (N, mu, sigma) {sum (i, 0, N, NDist (N, mu,
sigma))}
#declare NDist_cdf2 = function (N, mu, sigma) {sum (i, 0, N, NDist (i, mu,
sigma))}
#declare NDist_cdf3 = function (N, mu, sigma) {sum (i, 0, N, NDist ((i+N)/2,
mu, sigma))}
Has anyone ever tried to use sum () to graph a running tally of a function, or
have any idea what I'm doing wrong?
Have I broken POV-Ray _*AGAIN*_???!
Post a reply to this message
Attachments:
Download 'importancesamplingtest1.png' (67 KB)
Preview of image 'importancesamplingtest1.png'
|
|