 |
 |
|
 |
|
 |
|  |
|  |
|
 |
|
 |
|  |
|  |
|
 |
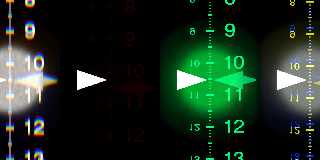
A test scene for refraction and dispersion, run on genuine POV-Ray
3.7.0.beta.34.
From left to right:
(1) no refraction
(2) refraction at a single interface between air (camera side) and a
medium with ior of 1.5 (scale/background side), tilted by 30 degrees
(3) ditto, but with dispersion (1.013, 20 samples)
(4) ditto, but with stronger dispersion (1.027) and only 2 samples
(5)-(8) ditto, but with 3 to 6 samples respectively
Common setup for each section is as follows:
- A fixed self-illuminated white scale mounted behind the refracting
interface, with 1-degrees divisions (numbered) and 0.5- and 0.1-degrees
subdivisions.
- A diffusely reflecting white background screen.
- Two self-illuminated white indicator shapes, one mounted in fixed
position in front of the refracting interface (left triangular shape),
another mounted at the scale (right triangular shape) at a precomupted
position so that it should line up with the other indicator.
- A spotlight source close to the camera, with photons enabled, which
should be visible as a blurred grey disk around the indicators' position.
Things to note in this render (which took 74 seconds on a Core i7 machine):
- The shortest-wavelength (extreme violet) sample is invariably
invisible, and the longest-wavelength (extreme red) almost so as well.
- Extremely low sample counts lead to wrong hues.
- The perceived "center" of the reflected image is slightly off when
using dispersion.
Conclusion: POV-Ray 3.7.0.beta.34 gets dispersion wrong. (Note however
that the same scene, rendered with POV-Ray 3.6, gives virtually
identical results, so the problem has been around a while.)
(Aside from the problems demonstrated here, POV-Ray 3.7.0.beta.34 also
has additional problems when more than one interface is involved - such
as with prisms - which POV-Ray 3.6 does not have. I'll demonstrate those
in a follow-up.)
Post a reply to this message
Attachments:
Download 'refraction_test_370beta34.png' (469 KB)
Preview of image 'refraction_test_370beta34.png'
|
 |
|  |
|  |
|
 |
|
 |
|  |
|  |
|
 |
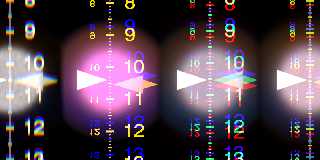
Here's the same scene rendered with a patched beta.34 (84 seconds; the
difference might be due to adc_bailout kicking in for the "ultraviolet"
rays with genuine beta.34).
Note how this patch keeps the lowest- and highest-wavelength samples
well within the visible realm for low sample counts, without adversely
affecting high sample counts. However, the hue is still adversely affected.
Post a reply to this message
Attachments:
Download 'refraction_test_patch_a.png' (602 KB)
Preview of image 'refraction_test_patch_a.png'
|
 |
|  |
|  |
|
 |
|
 |
|  |
|  |
|
 |
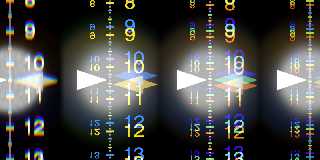
clipka schrieb:
... and another patch; notice how the color "sum" remains stable now
even with extremely low dispersion sample count. (79 seconds render time)
Post a reply to this message
Attachments:
Download 'refraction_test_patch_b.png' (595 KB)
Preview of image 'refraction_test_patch_b.png'
|
 |
|  |
|  |
|
 |
|
 |
|  |
|  |
|
 |
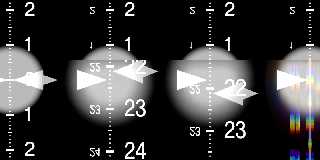
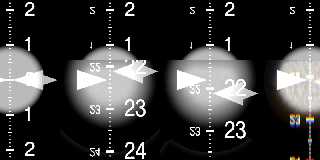
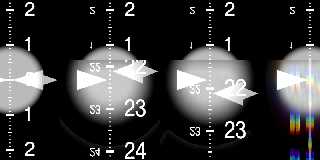
Similar test setup as before, but now with prisms.
Left to right:
(1) no prism, for reference
(2) prism with an ior of 1.303; front and back face tilted by 30 and -30
degrees, respectively
(3) ditto, but with an ior of 1.297
(4) ditto, but with an ior of 1.3 and a dispersion of 1.303/1.297 (20
samples). Note that this should give an effective ior of approximately
1.297 to 1.303, depending on wavelength.
The indicators for (2)-(4) are set for an ior of 1.3 in all cases.
First render was done with POV-Ray 3.6.2; note how the dispersion in (4)
"smears" the image of the marker quite exactly between the positions in
(2) and (3).
Second render was done with POV-Ray 3.7.0.beta.34; note how the
dispersion effect is barely noticeable.
The third render was done with a patched beta.34; note how the
dispersion now matches again.
Post a reply to this message
Attachments:
Download 'refraction_test_prism_362.png' (138 KB)
Download 'refraction_test_prism_370beta34.png' (137 KB)
Download 'refraction_test_prism_patch.png' (145 KB)
Preview of image 'refraction_test_prism_362.png'
Preview of image 'refraction_test_prism_370beta34.png'
Preview of image 'refraction_test_prism_patch.png'
|
 |
|  |
|  |
|
 |
|
 |
|  |
|  |
|
 |
Excellent work, sir! You are entitled to a bonus :-)
Thomas
Post a reply to this message
|
 |
|  |
|  |
|
 |
|
 |
|  |
|  |
|
 |
Thomas de Groot schrieb:
> Excellent work, sir! You are entitled to a bonus :-)
I'm still not happy with the whole smash.
Notice the brightness "peak" in the violet range? Doesn't appear natural
to me.
Right until beta.34, POV-Ray has been using a rather obscure and sketchy
formula to compute spectral colors, based on data from the 'net that I
didn't manage to track down. This makes it difficult to determine (a)
what color space the underlying data was designed for, (b) whether the
original data was gamma-precorrected or not, and (c) what wavelengths
the code is normalized to.
I tried to replace the formula with an interpolation table generated
from physical data normalized to the sRGB color space, but it looked
even worse.
(I did replace the formula with a table though - using values generated
directly from the formula for now - as this was needed to address the
"color drift" that occurred with low dispersion sample count.)
Post a reply to this message
|
 |
|  |
|  |
|
 |
|
 |
|  |
|  |
|
 |
clipka wrote:
> I'm still not happy with the whole smash.
>
> Notice the brightness "peak" in the violet range? Doesn't appear natural
> to me.
>
> Right until beta.34, POV-Ray has been using a rather obscure and sketchy
> formula to compute spectral colors, based on data from the 'net that I
> didn't manage to track down. This makes it difficult to determine (a)
> what color space the underlying data was designed for, (b) whether the
> original data was gamma-precorrected or not, and (c) what wavelengths
> the code is normalized to.
It seems the code tries to mimic the CIE CMF (color matching function)
within r,g,b values. Note the two peaks of the red component. I do not
know how well this is done but I do see two problems:
CIE reference white is D50 and not D65 as within s(c)RGB and the CMF
tables of course refer to the CIE xyz color space.
> I tried to replace the formula with an interpolation table generated
> from physical data normalized to the sRGB color space, but it looked
> even worse.
???
> (I did replace the formula with a table though - using values generated
> directly from the formula for now - as this was needed to address the
> "color drift" that occurred with low dispersion sample count.)
As an accurate in place calculation is quite computing intensive and as
you have already implemented a LUT it should be fairly easy to fill it
with accurate rgb values depending on the wavelength by using a bit of
POV-Ray SDL from my CIE.inc file and the macro
Wavelength2RGB(wavelength) from there.
like this:
#include "CIE.inc"
#declare WL_MIN = 385; //values below will not contribute much
#declare WL_MAX = 700; //values above are almost invisible
#declare WL_STEP = 5; //or whatever value is useful for your lut.
#declare WL = WL_MIN;
#while (WL <= WL_MAX)
#declare WL_RGB = Wavelength2RGB(WL);
/*
now write the WL_RGB value to a file or to the message pane or whatever
and use them for the POV-Ray source code LUT...
*/
#declare WL = WL + WL_STEP;
#end
Should be used with the default settings (sRGB primaries,
D65 whitepoint, D50 reference white and Bradford chromatic adaption).
It will fulfill the criteria that integrating over all samples will
result in *white*. The values close to UV and IR will become darker (as
they should) so the violet peak you did observe should disappear.
As I have not the faintest idea how the POV-Ray photon code is working
a few additional notes:
The values that are returned from 'Wavelength2RGB' are NOT normalized,
so maybe there should be a constant multiplier for all values (to make
them exactly fit into the 0.0 - 1.0 range).
The values that are chosen for WL_MIN and WL_MAX (or better how the
dispersion samples within POV-Ray are spread out) will have a huge
impact on the visual appearance, so for a low count of dispersion
samples they should be limited to only spread from e.g. 440nm to 640nm
(but only guessing here, has to be tried out).
So even if the values returned by Wavelength2RGB are perfectly accurate
there will be some trial and error involved to find visually good
looking values for the min and max dispersion spread especially when
only few samples are used.
-Ive
Post a reply to this message
|
 |
|  |
|  |
|
 |
|
 |
|  |
|  |
|
 |
Ive schrieb:
> It seems the code tries to mimic the CIE CMF (color matching function)
> within r,g,b values. Note the two peaks of the red component. I do not
> know how well this is done but I do see two problems:
> CIE reference white is D50 and not D65 as within s(c)RGB and the CMF
> tables of course refer to the CIE xyz color space.
Shouldn't the white point issue be addressed properly by the standard
XYZ->sRGB color space mapping?
Presuming of course that this (or something similar) was done by the
author of the function.
>> I tried to replace the formula with an interpolation table generated
>> from physical data normalized to the sRGB color space, but it looked
>> even worse.
>
> ???
Step 1: Grab the CIE tristimulus data. I would have expected this to
have given me spectral band colors in CIE XYZ color space.
Step 2: Convert CIE XYZ colors to sRGB primaries and white point using
the matrix as defined in the sRGB standard
Step 3: Fix gamut.
>> (I did replace the formula with a table though - using values
>> generated directly from the formula for now - as this was needed to
>> address the "color drift" that occurred with low dispersion sample
>> count.)
>
> As an accurate in place calculation is quite computing intensive and as
> you have already implemented a LUT it should be fairly easy to fill it
> with accurate rgb values depending on the wavelength by using a bit of
> POV-Ray SDL from my CIE.inc file and the macro
> Wavelength2RGB(wavelength) from there.
That's one reason (of multiple) why I modified the code to use a LUT now.
You got something already? Hey, me wants that!
Ah, you even included code... neat. I'll give it a try, thanks!
> Should be used with the default settings (sRGB primaries,
> D65 whitepoint, D50 reference white and Bradford chromatic adaption).
Ah, um... which means?
Well, never mind - I guess it'll be substantial enough to at least give
me a hint what to google for.
> It will fulfill the criteria that integrating over all samples will
> result in *white*. The values close to UV and IR will become darker (as
> they should) so the violet peak you did observe should disappear.
>
> As I have not the faintest idea how the POV-Ray photon code is working
> a few additional notes:
> The values that are returned from 'Wavelength2RGB' are NOT normalized,
> so maybe there should be a constant multiplier for all values (to make
> them exactly fit into the 0.0 - 1.0 range).
> The values that are chosen for WL_MIN and WL_MAX (or better how the
> dispersion samples within POV-Ray are spread out) will have a huge
> impact on the visual appearance, so for a low count of dispersion
> samples they should be limited to only spread from e.g. 440nm to 640nm
> (but only guessing here, has to be tried out).
The approach used by POV-Ray 3.6 (and 3.7 up intil beta.34) was to
spread from what could have been 380 nm to something like 730 nm; for a
3-sample dispersion it would then take wavelengths 380 nm, 555 nm and
730 nm. Which is obviously highly bogus because 380 nm and 730 nm are
virtually black already.
My current approach differs in two respects:
(1) As far as refraction angles are concerned, I allow for a
half-"bandwidth" marging near the edges of the visible spectrum; that
is, for instance with a 3-sample dispersion, sample rays will be assumed
to have wavelengths of 438 nm, 555 nm, and 672 nm, respectively.
(2) As far as sample ray colors are concerned, I'm not using /sample/
colors, but /integrated/ colors; that is, for instance in the 3-sample
dispersion example, the 438 nm ray would be colored as if it was a
bundle of rays from 380 to 497 nm; the 555 nm ray would be colored like
a bundle of rays from 497 nm to 613 nm; and the 672 nm ray would be
colored like a bundle of rays from 613 to 730 nm.
The lookup table is already adapted for this purpose, storing integrals
of the colors from 380 nm to X in steps of 5 nm; an individual ray will
then be colored by looking up two values from the table (for the ray's
nominal wavelength plus/minus half its "bandwidth"), and coloring the
ray according to the difference.
> So even if the values returned by Wavelength2RGB are perfectly accurate
> there will be some trial and error involved to find visually good
> looking values for the min and max dispersion spread especially when
> only few samples are used.
I think the integration approach does not suffer from this problem at all.
Post a reply to this message
|
 |
|  |
|  |
|
 |
|
 |
|  |
|
 |


![]()