|
|
|
|
|
|
| |
| |
|
|
|
|
| |
| |
|
|
Invisible a écrit :
> I did take a look at the "dot" tool - but it tends to produce utterly
> horrid graphs. I mean, *astonishingly* bad graphs.
Perhaps it would be wise, before writing such statements, to ensure that
your own tool reaches at least an equivalent quality ;-)
--
Vincent
Post a reply to this message
|
|
| |
| |
|
|
|
|
| |
| |
|
|
Vincent Le Chevalier wrote:
> Invisible a écrit :
>> I did take a look at the "dot" tool - but it tends to produce utterly
>> horrid graphs. I mean, *astonishingly* bad graphs.
>
> Perhaps it would be wise, before writing such statements, to ensure that
> your own tool reaches at least an equivalent quality ;-)
Well, thus far my tool has succeeded in not putting nodes on top of each
other, and so their labels are at least readable. That's an improvement,
if only a small one.
Post a reply to this message
|
|
| |
| |
|
|
|
|
| |
| |
|
|
Invisible a écrit :
> Vincent Le Chevalier wrote:
>> Invisible a écrit :
>>> I did take a look at the "dot" tool - but it tends to produce utterly
>>> horrid graphs. I mean, *astonishingly* bad graphs.
>>
>> Perhaps it would be wise, before writing such statements, to ensure
>> that your own tool reaches at least an equivalent quality ;-)
>
> Well, thus far my tool has succeeded in not putting nodes on top of each
> other, and so their labels are at least readable. That's an improvement,
> if only a small one.
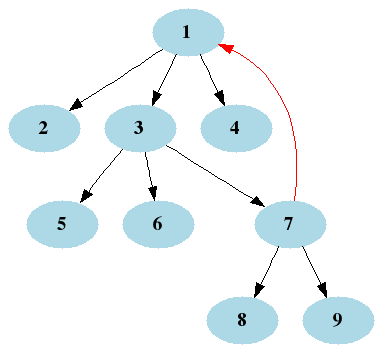
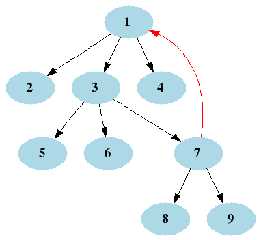
Except I have no such problem with dot...
Example:
digraph "" {
node [shape=ellipse, color=lightblue, style=filled, fontname="Times-Bold"]
p1 [label="1"];
p2 [label="2"];
p3 [label="3"];
p4 [label="4"];
p5 [label="5"];
p6 [label="6"];
p7 [label="7"];
p8 [label="8"];
p9 [label="9"];
edge [color=black]
p1 -> p2
p1 -> p3
p1 -> p4
p3 -> p5
p3 -> p6
p3 -> p7
p7 -> p8
p7 -> p9
edge [color=red]
p7 -> p1
}
gives the image attached. Probably not the most terse way since I
adapted it from a computer-generated dot file.
What's wrong?
--
Vincent
Post a reply to this message
Attachments:
Download 'example.png' (4 KB)
Preview of image 'example.png'
|
|
| |
| |
|
|
|
|
| |
| |
|
|
>>> Perhaps it would be wise, before writing such statements, to ensure
>>> that your own tool reaches at least an equivalent quality ;-)
>>
>> Well, thus far my tool has succeeded in not putting nodes on top of
>> each other, and so their labels are at least readable. That's an
>> improvement, if only a small one.
>
> Except I have no such problem with dot...
>
> Example:
>
> digraph "" {
> node [shape=ellipse, color=lightblue, style=filled, fontname="Times-Bold"]
> p1 [label="1"];
> p2 [label="2"];
> p3 [label="3"];
> p4 [label="4"];
> p5 [label="5"];
> p6 [label="6"];
> p7 [label="7"];
> p8 [label="8"];
> p9 [label="9"];
>
> edge [color=black]
> p1 -> p2
> p1 -> p3
> p1 -> p4
> p3 -> p5
> p3 -> p6
> p3 -> p7
> p7 -> p8
> p7 -> p9
> edge [color=red]
> p7 -> p1
> }
>
> gives the image attached. Probably not the most terse way since I
> adapted it from a computer-generated dot file.
>
> What's wrong?
That's interesting. I never managed to get a result to look that nice.
(Although a little AA certainly wouldn't hurt!)
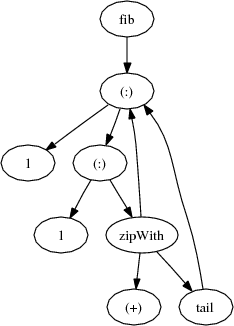
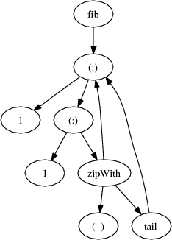
What happens if you try it with this?
digraph ""
{
n1 [label="fib"]
n2 [label="(:)"]
n3 [label="1"]
n4 [label="(:)"]
n5 [label="1"]
n6 [label="zipWith"]
n7 [label="(+)"]
n8 [label="tail"]
n1 -> n2
n2 -> n3
n2 -> n4
n4 -> n5
n4 -> n6
n6 -> n7
n6 -> n2
n6 -> n8
n8 -> n2
}
I eventually managed to get this to look half reasonable with my own
tool, but still not great.
Post a reply to this message
|
|
| |
| |
|
|
|
|
| |
| |
|
|
Invisible a écrit :
> (Although a little AA certainly wouldn't hurt!)
Yes, thankfully dot can output vector graphics so that's easy to settle.
Actually maybe the antialiasing in newer versions is better with the
direct png export...
> What happens if you try it with this?
This (antialiased by converting from ps to png with ImageMagick).
--
Vincent
Post a reply to this message
Attachments:
Download 'example.png' (5 KB)
Preview of image 'example.png'
|
|
| |
| |
|
|
|
|
| |
| |
|
|
>> (Although a little AA certainly wouldn't hurt!)
>
> Yes, thankfully dot can output vector graphics so that's easy to settle.
> Actually maybe the antialiasing in newer versions is better with the
> direct png export...
OK, that settles that then.
>> What happens if you try it with this?
>
> This (antialiased by converting from ps to png with ImageMagick).
OK, well that's pretty smooth looking. Certainly neater than what my
program produced.
The only thing I can think of is that maybe last time I tried dot out
while I was trying to do really complex mind maps and the vast number of
nodes and dense interconnections upset the layout algorithm. Certainly
your examples seem to be laid out just fine.
One small issue is that for the graphs I'm interested in, the ordering
of the edges is significant. That is,
n25 -> n82
n25 -> n133
means something different to
n25 -> n133
n25 -> n82
But dot will of course render them identically. I'm wondering if there's
a way to work round that. Maybe add some smaller nodes to label the
edges? (Presumably you can do that?)
Post a reply to this message
|
|
| |
| |
|
|
|
|
| |
| |
|
|
On 8-4-2009 11:48, Invisible wrote:
> I wrote a program that takes a connection list such as
>
> [
> (1, n [b 2, b 3, b 4]),
> (2, n []),
> (3, n [b 5, b 6, b 7]),
> (4, n []),
> (5, n []),
> (6, n []),
> (7, n [b 8, b 9, a 1]),
> (8, n []),
> (9, n [])
> ]
>
> and generates an image such as the one attached.
>
> Trouble is... it's not a very good graphic, is it? :-/
>
> ------------------------------------------------------------------------
>
My first suggestion would be to use a metapost or latex package. Not
sure if that is an option.
Post a reply to this message
|
|
| |
| |
|
|
|
|
| |
| |
|
|
Invisible a écrit :
> One small issue is that for the graphs I'm interested in, the ordering
> of the edges is significant. That is,
>
> n25 -> n82
> n25 -> n133
>
> means something different to
>
> n25 -> n133
> n25 -> n82
>
> But dot will of course render them identically. I'm wondering if there's
> a way to work round that. Maybe add some smaller nodes to label the
> edges? (Presumably you can do that?)
Oh, you can even add labels to the edges directly withput having to add
a node :-)
If edge order is important apparently adding ordering=out at the graph
level will draw the outgoing edges of each node in the order they are
encountered. Of course this will possibly create more edge
interesections than necessary...
Anyway, I'm not saying that GraphViz can do absolutely anything you
might need. But you should look into it deeper than just "it broke down
the day I fed it an enormous graph with all the options at their default
value" :-D And the documentation seems good enough...
I wonder what your own tool would do with the graphs you tested dot on
originally, by the way ;-)
--
Vincent
Post a reply to this message
|
|
| |
| |
|
|
|
|
| |
| |
|
|
Vincent Le Chevalier wrote:
> Oh, you can even add labels to the edges directly withput having to add
> a node :-)
>
> If edge order is important apparently adding ordering=out at the graph
> level will draw the outgoing edges of each node in the order they are
> encountered. Of course this will possibly create more edge
> interesections than necessary...
That's interesting. I'll have to take a look at that.
> I wonder what your own tool would do with the graphs you tested dot on
> originally, by the way ;-)
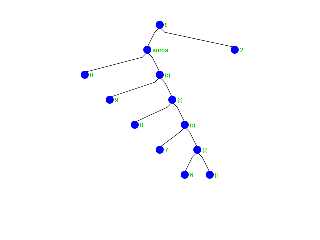
Break horrifyingly. My new tool is designed speicifically for the one
particular graphing problem I'm trying to solve today. I've got it to
work modestly well so far...
Post a reply to this message
Attachments:
Download 'length8.g.png' (3 KB)
Preview of image 'length8.g.png'
|
|
| |
| |
|
|
|
|
| |
| |
|
|
Invisible wrote:
> Break horrifyingly. My new tool is designed speicifically for the one
> particular graphing problem I'm trying to solve today. I've got it to
> work modestly well so far...
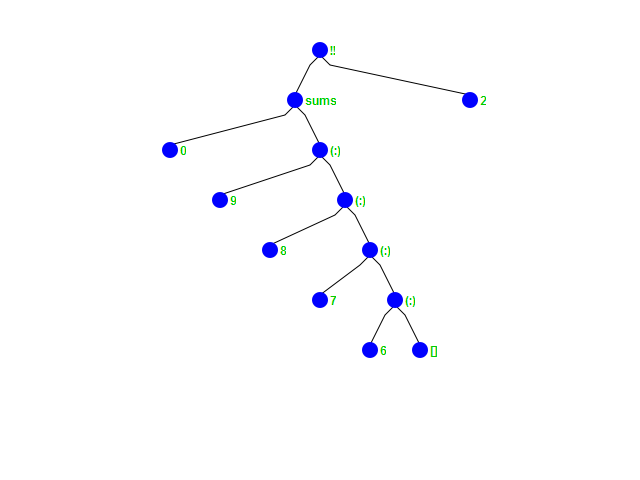
LOL! Attached the wrong damn imaged...
Post a reply to this message
Attachments:
Download 'index1.g.png' (10 KB)
Preview of image 'index1.g.png'
|
|
| |
| |
|
|
|
|
| |