|
 |
Invisible a écrit :
> Vincent Le Chevalier wrote:
>> Invisible a écrit :
>>> I did take a look at the "dot" tool - but it tends to produce utterly
>>> horrid graphs. I mean, *astonishingly* bad graphs.
>>
>> Perhaps it would be wise, before writing such statements, to ensure
>> that your own tool reaches at least an equivalent quality ;-)
>
> Well, thus far my tool has succeeded in not putting nodes on top of each
> other, and so their labels are at least readable. That's an improvement,
> if only a small one.
Except I have no such problem with dot...
Example:
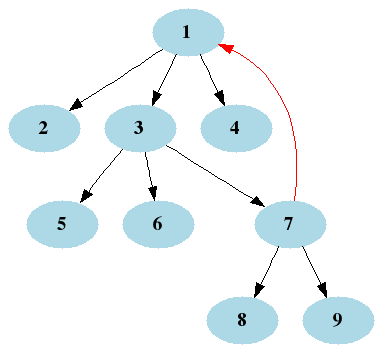
digraph "" {
node [shape=ellipse, color=lightblue, style=filled, fontname="Times-Bold"]
p1 [label="1"];
p2 [label="2"];
p3 [label="3"];
p4 [label="4"];
p5 [label="5"];
p6 [label="6"];
p7 [label="7"];
p8 [label="8"];
p9 [label="9"];
edge [color=black]
p1 -> p2
p1 -> p3
p1 -> p4
p3 -> p5
p3 -> p6
p3 -> p7
p7 -> p8
p7 -> p9
edge [color=red]
p7 -> p1
}
gives the image attached. Probably not the most terse way since I
adapted it from a computer-generated dot file.
What's wrong?
--
Vincent
Post a reply to this message
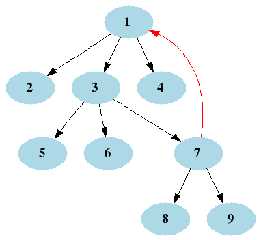
Attachments:
Download 'example.png' (4 KB)
Preview of image 'example.png'
|
|