|
 |
Paul Bourke <pdb### [at] swin eduau> wrote:
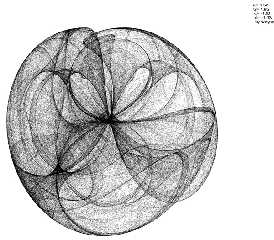
> Readers might like to note that while this "looks" like a 3D model
> and it was created using PovRay (a 3D rendering package), it is in fact
> only 2D ... it's our brain that prefers to make sense of the twirls as
> a 3D object.
>
> --
> Paul Bourke
> pdb(NOSPAM)swin.edu.au
These attractor plots seem to be much different then your tree attractors
where the particle comes in and gets stuck as it builds? Why is it called
Peter De Jong 'attractors'?
After getting my coding to work I found J. Tarbell's site where he creates
the 2-D Peter De Jong plots
(http://www.complexification.net/gallery/machines/peterdejong/) using
processing in an animated (and much faster method and able to handle more
without memory problems/strange error problems Povray spits out for certain
values of a,b,c,d and number of points) using the program Processing. I
would have missed out on the thrill of getting it working on my own had I
found that first. I was glad to see his code was very similar to mine, but
he had a line in his that looks like it changes d value as it goes along
but I couldn't note any changes with that line commented out.
Here is that line in the code:
float d = sqrt((xn-x)*(xn-x) + (yn-y)*(yn-y));
and here is the code segement it is in
void draw() {
// move through time
xn = sin(a*y) - cos(b*x);
yn = sin(c*x) - cos(d*y);
float d = sqrt((xn-x)*(xn-x) + (yn-y)*(yn-y));
x = xn;
y = yn;
// render single transparent pixel
stroke(0,5);
point((x/gs+gx)*dim,(y/gs+gy)*dim);
Any ideas what this would do?
The other odd thing is that in the first image J. Tarbell posts there at his
site where he gives the a,b,c,d values (a=-1.793 b=-0.2958 c=-2.315
d=0.4081) those values makes my povray program spit out an error while
others that you (Paul) posted (such as a = 1.4, b = -2.3, c = 2.4, d = -2.1
; at http://astronomy.swin.edu.au/~pbourke/fractals/peterdejong/) work well
and give the same plots as you got. I would guess it is limits of Povray
since my plots look the same using your values;however, maybe it has to do
with altering the d variable as his progresses?
Thanks,
Wayne eduau> wrote:
> Readers might like to note that while this "looks" like a 3D model
> and it was created using PovRay (a 3D rendering package), it is in fact
> only 2D ... it's our brain that prefers to make sense of the twirls as
> a 3D object.
>
> --
> Paul Bourke
> pdb(NOSPAM)swin.edu.au
These attractor plots seem to be much different then your tree attractors
where the particle comes in and gets stuck as it builds? Why is it called
Peter De Jong 'attractors'?
After getting my coding to work I found J. Tarbell's site where he creates
the 2-D Peter De Jong plots
(http://www.complexification.net/gallery/machines/peterdejong/) using
processing in an animated (and much faster method and able to handle more
without memory problems/strange error problems Povray spits out for certain
values of a,b,c,d and number of points) using the program Processing. I
would have missed out on the thrill of getting it working on my own had I
found that first. I was glad to see his code was very similar to mine, but
he had a line in his that looks like it changes d value as it goes along
but I couldn't note any changes with that line commented out.
Here is that line in the code:
float d = sqrt((xn-x)*(xn-x) + (yn-y)*(yn-y));
and here is the code segement it is in
void draw() {
// move through time
xn = sin(a*y) - cos(b*x);
yn = sin(c*x) - cos(d*y);
float d = sqrt((xn-x)*(xn-x) + (yn-y)*(yn-y));
x = xn;
y = yn;
// render single transparent pixel
stroke(0,5);
point((x/gs+gx)*dim,(y/gs+gy)*dim);
Any ideas what this would do?
The other odd thing is that in the first image J. Tarbell posts there at his
site where he gives the a,b,c,d values (a=-1.793 b=-0.2958 c=-2.315
d=0.4081) those values makes my povray program spit out an error while
others that you (Paul) posted (such as a = 1.4, b = -2.3, c = 2.4, d = -2.1
; at http://astronomy.swin.edu.au/~pbourke/fractals/peterdejong/) work well
and give the same plots as you got. I would guess it is limits of Povray
since my plots look the same using your values;however, maybe it has to do
with altering the d variable as his progresses?
Thanks,
Wayne
Post a reply to this message
Attachments:
Download 'peter de jong attractors11.jpg' (202 KB)
Preview of image 'peter de jong attractors11.jpg'
|
|


