|
 |
All I can say is "why not." Calculators cost money but you can make one for
free. Actually I have my old HP48 but wanted to do this anyway.
Where I got stuck before (this is an old project which I recently came back
to) was that I needed to be able to have a whole arbitrary expression as a
string that I could display as well as evaluating it to a float that I
could plot. val() of course can convert a string literal to a float, but
val("2+2") returns the number 2.
It seemed somewhat cumbersome to do so, but I finally gave in and outputted
strings to a file, to be read back in as a macro holding an expression.
Here's that macro to create the temp file:
#macro Make_Temporary_Expression_Macro_File(Eq)
#fopen Calculator_Temp_Expression_File
"Temporary_Expression_Macro_File.tmp" write
#write (Calculator_Temp_Expression_File, "/* This is a temporary
file generated and used by calculator.pov and can be deleted without harm.
*/n")
#write (Calculator_Temp_Expression_File, "#macro Evaluate_Eq_For_X
(X) n")
#write (Calculator_Temp_Expression_File, " #declare Eq_Y = " )
#write (Calculator_Temp_Expression_File, Eq ) //the function
#write (Calculator_Temp_Expression_File, "; n#end n" )
#fclose Calculator_Temp_Expression_File
#end // end Make_Temporary_Expression_Macro_File
Any better ideas? The little temp file gets written over once for each
function and once for each expression.
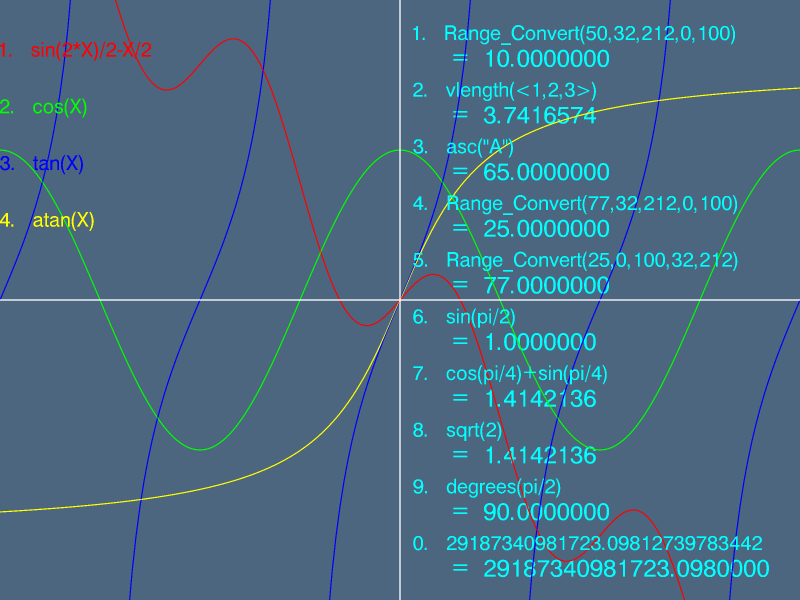
The way it is now the calculator will display up to 10 funtions, and 10
expressions with their evaluated answers. Functions can be displayed as
either lines or dots, line thickness can be set for each function as well
as how frequently along the x-axis the funtion is evaluated. (200 times
seems like a good number for most.)
The viewable region is adjustable (-2*pi to 2*pi for x and -2 to 2 for y as
displayed here) and each funtion will only be plotted where they coincide
with that region; they do not get scaled independantly as they don't have
independant ranges. I also haven't gotten around to making auto-adjusting
hash marks for the axis yet.
Thanks,
Charles
Post a reply to this message
Attachments:
Download 'calculator.png' (79 KB)
Preview of image 'calculator.png'
|
|