|
|
|
|
|
|
| |
| |
|
|
From: kurtz le pirate
Subject: Re: Isosurface from magnitude of complex function with domain coloring
Date: 26 Dec 2021 06:13:42
Message: <61c84e66$1@news.povray.org>
|
|
|
| |
| |
|
|
On 26/12/2021 03:00, Tor Olav Kristensen wrote:
>> ...
>
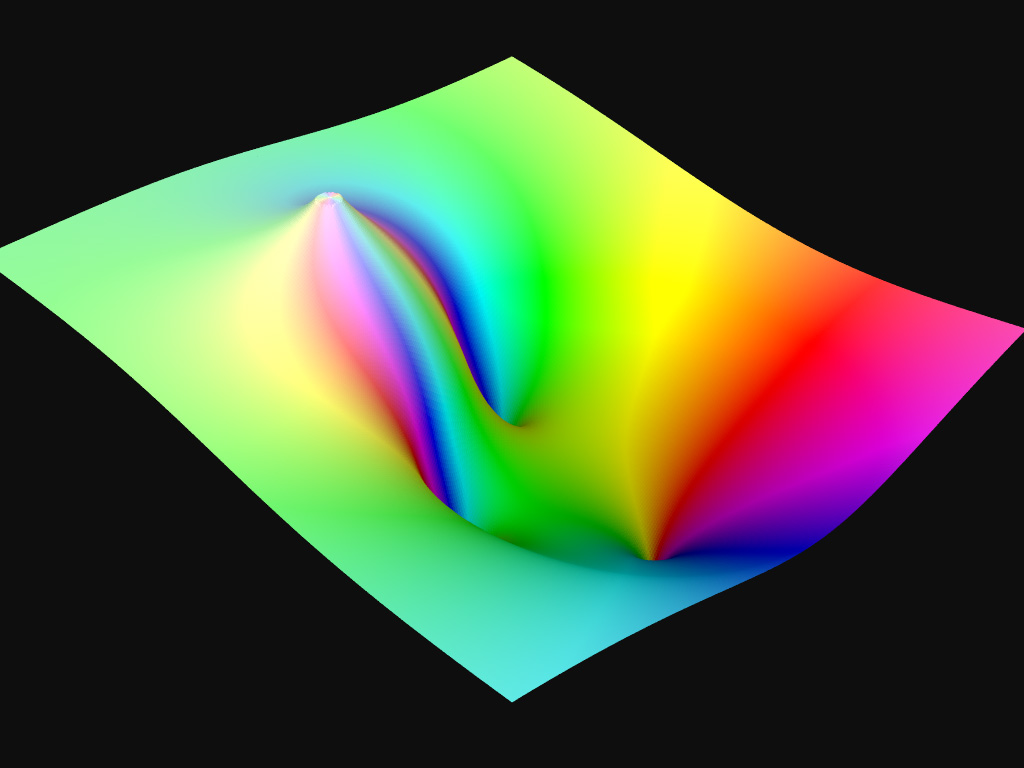
>> Here, one sample of f(z) = (-z^3 + iz^2 + 1) / (z - 1 + i)^2.
>
> ...
>
> I'm a bit worried though, because my renderings of that function is quite
> different from mine.
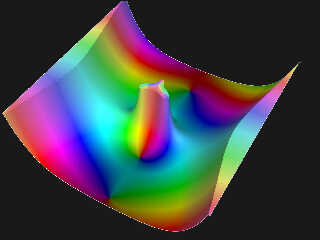
Sorry, I put the wrong picture :(
here, it's the good one.
> What is your rendering showing ?
> The magnitude, the real part or the imaginary part ? - or something else ?
let z = a + ib
f(z) = c +i d
Represented in POV in this way :
a >> x axis
b >> z axis
arg(c + id) >> the color in HSL space with H = arg and L = logaritmic
function of module between 0 and 1.
module(c + id) >> y axis with a logarithmic scale
--
Kurtz le pirate
Compagnie de la Banquise
Post a reply to this message
Attachments:
Download 'complex3dmesh_fn00.jpg' (82 KB)
Preview of image 'complex3dmesh_fn00.jpg'

|
|
| |
| |
|
|
|
|
| |
| |
|
|
"Tor Olav Kristensen" wrote:
> Thank you Bill !
Knowing partly what goes into all of this, I can see that it required a lot of
time and attention to detail - and you always post fairly polished images, even
if they are only WIPS.
>
> I'm not very familier wit Paul Nylander's work. Those macros seem like a good
> start for a library for complex calculations. But the Pow() macro could need
> some work to allow for the exponent to also be a complex number.
http://bugman123.com/index.html
Complex exponents --- Oh, it makes my head hurt to even thing about that.
> I did not create macros to do the calculations, but arrays of functions and
> macros that assemble functions into new functions. For each complex operator
> there's two functions; one for calculating the real part and one for calculating
> the imaginary part.
Yes, since you are doing isosurfaces, it would have to be that way.
Not having done a great deal personally with complex math, I wasn't about to
start writing things from scratch, and wanted to just see what "known good code"
would spit out.
>
> >...
> > I made these two to just keep track
> >
> > #macro Argument (Re, Im)
> > atan2 (Re, Im)
> > #end
> >
> > #macro Modulus (Re, Im)
> > sqrt (pow (Re, 2) + pow (Im, 2))
> > #end
>
> I like your Modulus() macro better than the Abs() macro, because it does not
> rely on the underlying implementation of how the complex numbers are
> represented. I think that as few as possible of the macros should depend on the
> underlying implementations.
I was just working off of the definitions of the terms. Sometimes I mix and
match things without worrying about things too much, just to see what works
without overcomplicating things early on.
> Btw.: Why have you chosen to have a different
> atan2() call in your Argument() macro than in the Arg() macro ?
I believe the first one is Paul's, and the last one is one I wrote from scratch.
Again, just from definition of the term. If that gave rise to any "errors" - I
figured I could go back and fix them once I had some geometry rendered to
visually see what the problems were.
> > This is looking great! I'm sure there are a lot of other interesting complex
> > surfaces to be explored.
>
> I've started on a Github repository for my library. It's here:
> https://github.com/t-o-k/POV-Ray-complex-functions
>
> Please note that this is a work in progress, so some features hasn't been added
> yet and much of it may change.
Nice. That would probably be well suited to printing out and looking over
during coffee break.
> > I'm also wondering how hard it would be to use mod()
> > to have an infinite array of those "black hole vortices" on a plane - in either
> > a rectangular or an alternating/hexagonal arrangement...
>
> That's an interesting idea: to have a mod() operator that can handle complex
> values. But I don't know how to implement that...
Naive question: Wouldn't you just process the Re and Im parts with mod first
before passing them on to the subsequent functions?
Maybe check out
http://www.dimensions-math.org/Dim_E.htm
and perhaps get in touch with the authors, since they seem to have an amazing
grasp of both the math as well as POV-Ray.
Post a reply to this message
|
|
| |
| |
|
|
From: Alain Martel
Subject: Re: Isosurface from magnitude of complex function with domain coloring
Date: 26 Dec 2021 12:32:39
Message: <61c8a737$1@news.povray.org>
|
|
|
| |
| |
|
|
Le 2021-12-25 à 19:17, Tor Olav Kristensen a écrit :
> Alain Martel <kua### [at] videotron ca> wrote:
>> Le 2021-12-22 à 19:34, BayashiPascal a écrit :
>>> "Tor Olav Kristensen" <tor### [at] TOBEREMOVEDgmailcom> wrote:
>>>> ...
>>>> And yesterday I made some functions that can be used for HSV-coloring of
>>>> pigments.
>>>> ...
>>>
>>> The "multi-layered" aspect of the result is intriguing me. Does it come from a
>>> property of the function you've choosen, or from the way you choose to visualise
>>> it ?
>>> ...
>> Do you mean the repeating gradient ?
>> It comes from the way the «V» of the HSV value is computed, and values
>> larger than 1 get their integer part zeroed.
>>
>> Then, it's mapped to a 0..0.5 range.
>>
>> It could look something like this :
>> colour_map{
>> [0 hsv2rgb(<Hvalue, 1, 0>)]
>> [1 hsv2rgb(<Hvalue, 1, 0.5>)]
>> }
>
> Sorry Alain. I made a mistake and wrote "HSV-coloring" above. I meant to write
> "HSL-coloring". (I haven't yet looked at how HSV formulas works.)
>
> Also see my answer to Pascal in my previous post.
>
> --
> Tor Olav
> http://subcube.com
> https://github.com/t-o-k
>
>
The HSV and HSL colour spaces are almost the same. The «V» component in
HSV does pretty much the same as the «L» in HSL. ca> wrote:
>> Le 2021-12-22 à 19:34, BayashiPascal a écrit :
>>> "Tor Olav Kristensen" <tor### [at] TOBEREMOVEDgmailcom> wrote:
>>>> ...
>>>> And yesterday I made some functions that can be used for HSV-coloring of
>>>> pigments.
>>>> ...
>>>
>>> The "multi-layered" aspect of the result is intriguing me. Does it come from a
>>> property of the function you've choosen, or from the way you choose to visualise
>>> it ?
>>> ...
>> Do you mean the repeating gradient ?
>> It comes from the way the «V» of the HSV value is computed, and values
>> larger than 1 get their integer part zeroed.
>>
>> Then, it's mapped to a 0..0.5 range.
>>
>> It could look something like this :
>> colour_map{
>> [0 hsv2rgb(<Hvalue, 1, 0>)]
>> [1 hsv2rgb(<Hvalue, 1, 0.5>)]
>> }
>
> Sorry Alain. I made a mistake and wrote "HSV-coloring" above. I meant to write
> "HSL-coloring". (I haven't yet looked at how HSV formulas works.)
>
> Also see my answer to Pascal in my previous post.
>
> --
> Tor Olav
> http://subcube.com
> https://github.com/t-o-k
>
>
The HSV and HSL colour spaces are almost the same. The «V» component in
HSV does pretty much the same as the «L» in HSL.
Post a reply to this message
|
|
| |
| |
|
|
From: Cousin Ricky
Subject: Re: Isosurface from magnitude of complex function with domaincoloring
Date: 26 Dec 2021 20:43:03
Message: <61c91a27@news.povray.org>
|
|
|
| |
| |
|
|
On 2021-12-26 13:32, Alain Martel wrote:
>>
> The HSV and HSL colour spaces are almost the same. The «V» component in
> HSV does pretty much the same as the «L» in HSL.
That depends on what you mean by "pretty much the same." (There was an
argument on Usenet about 20-ish years ago over exactly this term
regarding pointers vs. arrays in C. I commented that I once blew a job
interview for tacitly considering them "pretty much the same.") I'm
amused that you're saying this on a thread by the same person who
schooled us on the difference between points and vectors.
The difference between L and V actually changes the meaning of
saturation between HSL and HSV. Michael Horvath gives a pretty good
visualization here:
https://github.com/LeForgeron/PovContributions/blob/master/colorsolid/sharkd%201.3.0/colorsolid.png
Post a reply to this message
|
|
| |
| |
|
|
|
|
| |
| |
|
|
kurtz le pirate <kur### [at] gmailcom> wrote:
> On 26/12/2021 03:00, Tor Olav Kristensen wrote:
> >> ...
> >
> >> Here, one sample of f(z) = (-z^3 + iz^2 + 1) / (z - 1 + i)^2.
> >
> > ...
> >
> > I'm a bit worried though, because my renderings of that function is quite
> > different from mine.
>
> Sorry, I put the wrong picture :(
> here, it's the good one.
>
> > What is your rendering showing ?
> > The magnitude, the real part or the imaginary part ? - or something else ?
>
> let z = a + ib
> f(z) = c +i d
>
> Represented in POV in this way :
> a >> x axis
> b >> z axis
>
> arg(c + id) >> the color in HSL space with H = arg and L = logaritmic
> function of module between 0 and 1.
>
> module(c + id) >> y axis with a logarithmic scale
Ok, I see.
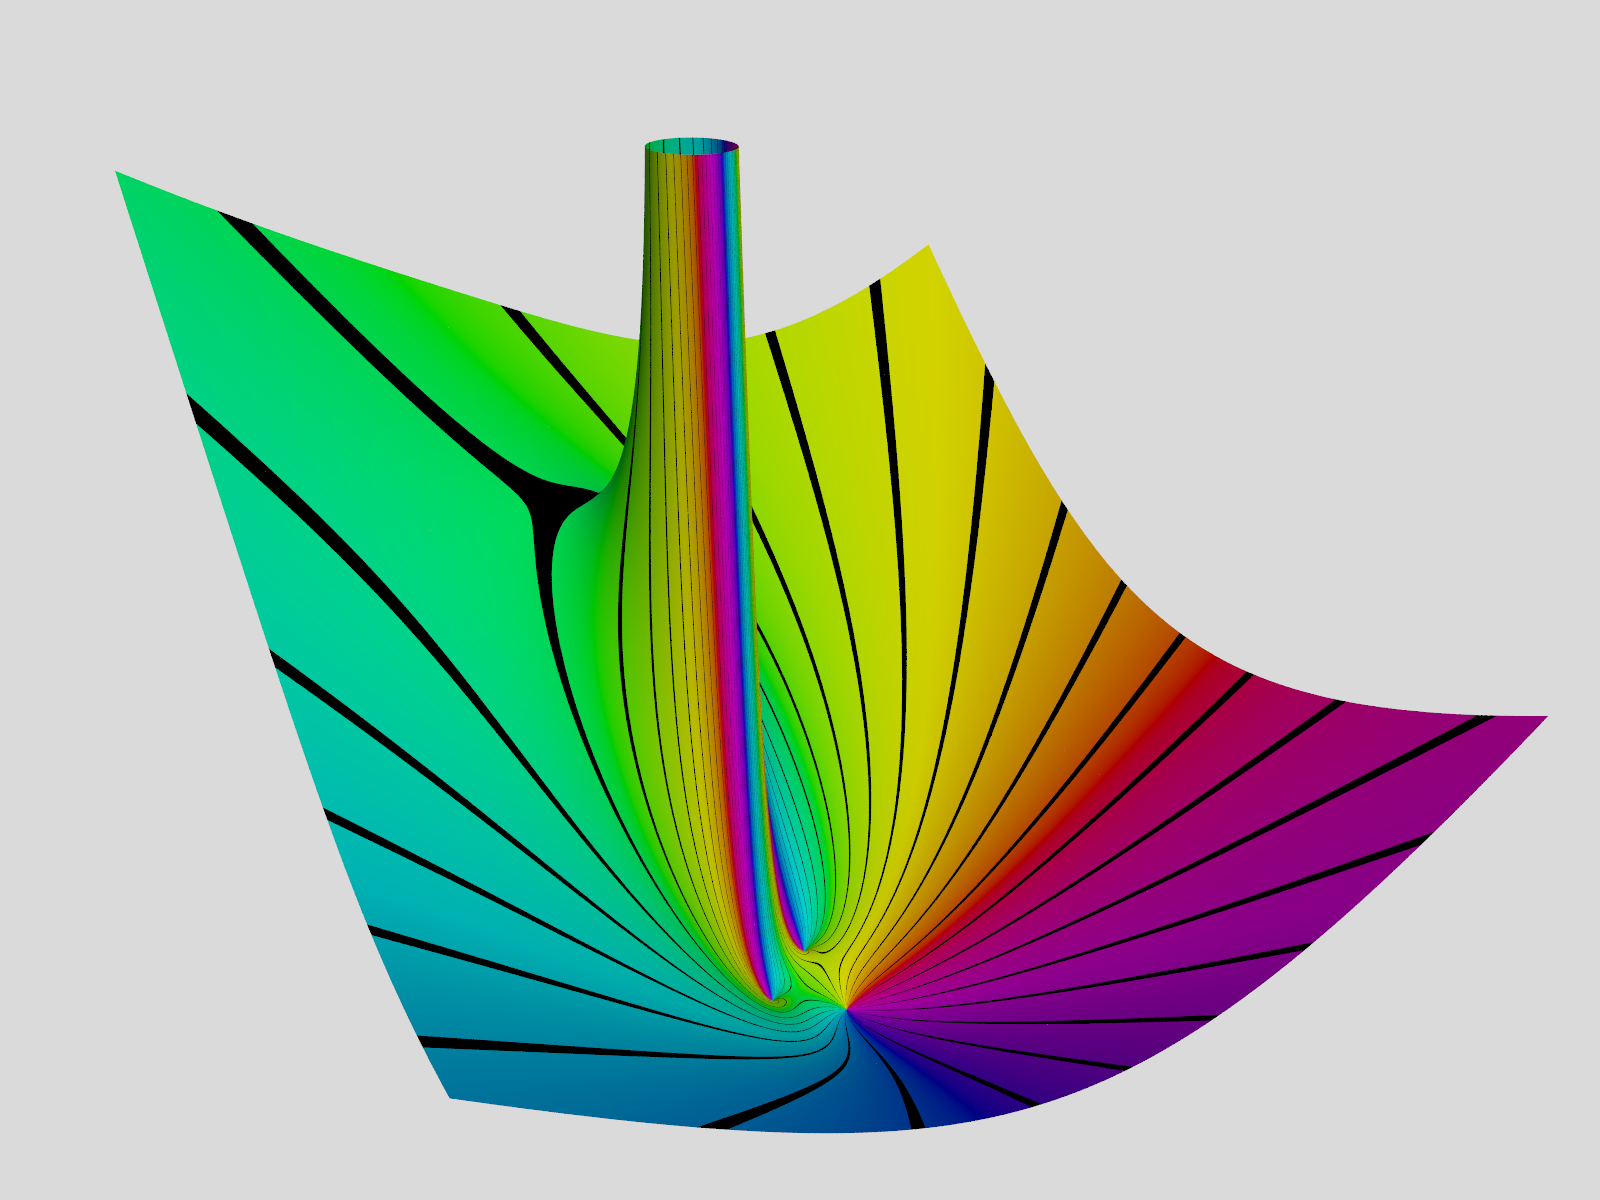
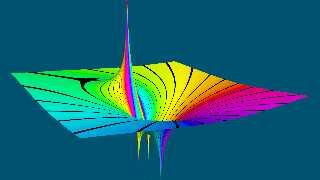
I've attached a similar rendering that I just I made of that function.
This time I've used used a mesh2 for the surface and added some black 1.5
degrees wide lines at 15 degrees intervals for the phase.
As you can see, the pole and the zeros seem to be located in a similar pattern,
but the area around the pole seems to be quite different.
I've tried to verify the functions I've created by feeding expressions to
Wolfram Alpha, like this:
https://www.wolframalpha.com/input/?i=%28-%283-4*i%29%5E3%2B%283-4*i%29%5E2*i%2B1%29%2F%28%283-4*i%29-1%2Bi%29%5E2
For the values of Z that I've tried, the results are the same as mine.
Perhaps you could do the same and compare with the results from your macros (?)
--
Tor Olav
http://subcube.com
https://github.com/t-o-k
Post a reply to this message
Attachments:
Download 'klps function.png' (396 KB)
Preview of image 'klps function.png'

|
|
| |
| |
|
|
|
|
| |
| |
|
|
"Tor Olav Kristensen" <tor### [at] TOBEREMOVEDgmailcom> wrote:
> kurtz le pirate <kur### [at] gmailcom> wrote:
> ...
> > module(c + id) >> y axis with a logarithmic scale
>
> Ok, I see.
What I did not notice was that you've used a logarithmic scale for y-axis.
That could explain the differences. Sorry.
--
Tor Olav
http://subcube.com
https://github.com/t-o-k
Post a reply to this message
|
|
| |
| |
|
|
From: kurtz le pirate
Subject: Re: Isosurface from magnitude of complex function with domain coloring
Date: 28 Dec 2021 10:10:28
Message: <61cb28e4@news.povray.org>
|
|
|
| |
| |
|
|
On 27/12/2021 03:46, Tor Olav Kristensen wrote:
> "Tor Olav Kristensen" <tor### [at] TOBEREMOVEDgmailcom> wrote:
>> kurtz le pirate <kur### [at] gmailcom> wrote:
>> ...
>>> module(c + id) >> y axis with a logarithmic scale
>>
>> Ok, I see.
>
> What I did not notice was that you've used a logarithmic scale for y-axis.
>
> That could explain the differences. Sorry.
Yes, I used a logarithmic scale for this image.This is really not a good
idea. In fact the use of logarithms comes from my previous frameworks
for visualizing complex functions in 2D.
For the argument, it works fine. For the modulus, you have to take
precautions. Everything depends on the values of the functions you want
to plot. The growth at infinity can be very brutal and you lose a lot of
information with a linear scale ... that's why I used logs. But that was
for 2D ! In 3D now, no need for that.
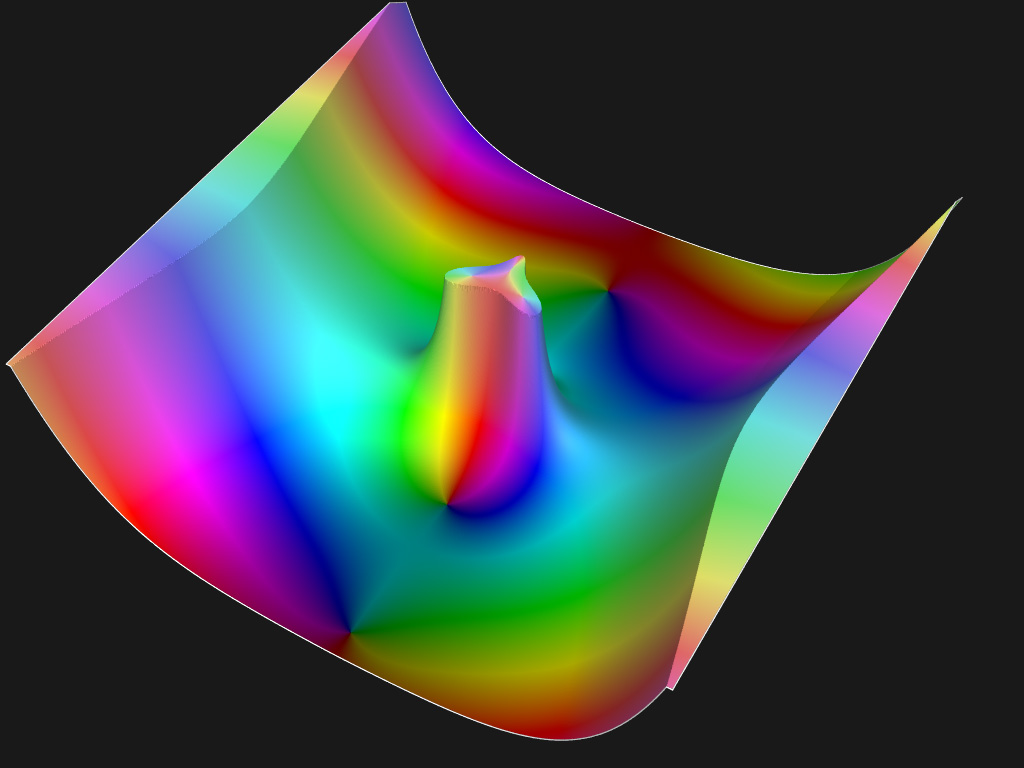
Attached is my latest work with some cosmetic additions.
The represented function is :
f(z)= (sin(z) + cos(z)) / (z^2 - iz)
with Re and Im between -6 and +6.
--
Kurtz le pirate
Compagnie de la Banquise
Post a reply to this message
Attachments:
Download 'complex3dmesh_fn6.jpg' (91 KB)
Preview of image 'complex3dmesh_fn6.jpg'
|
|
| |
| |
|
|
|
|
| |
| |
|
|
kurtz le pirate <kur### [at] gmailcom> wrote:
> On 27/12/2021 03:46, Tor Olav Kristensen wrote:
> > "Tor Olav Kristensen" <tor### [at] TOBEREMOVEDgmailcom> wrote:
> >> kurtz le pirate <kur### [at] gmailcom> wrote:
> >> ...
> >>> module(c + id) >> y axis with a logarithmic scale
> >>
> >> Ok, I see.
> >
> > What I did not notice was that you've used a logarithmic scale for y-axis.
> >
> > That could explain the differences. Sorry.
>
>
> Yes, I used a logarithmic scale for this image.This is really not a good
> idea. In fact the use of logarithms comes from my previous frameworks
> for visualizing complex functions in 2D.
>...
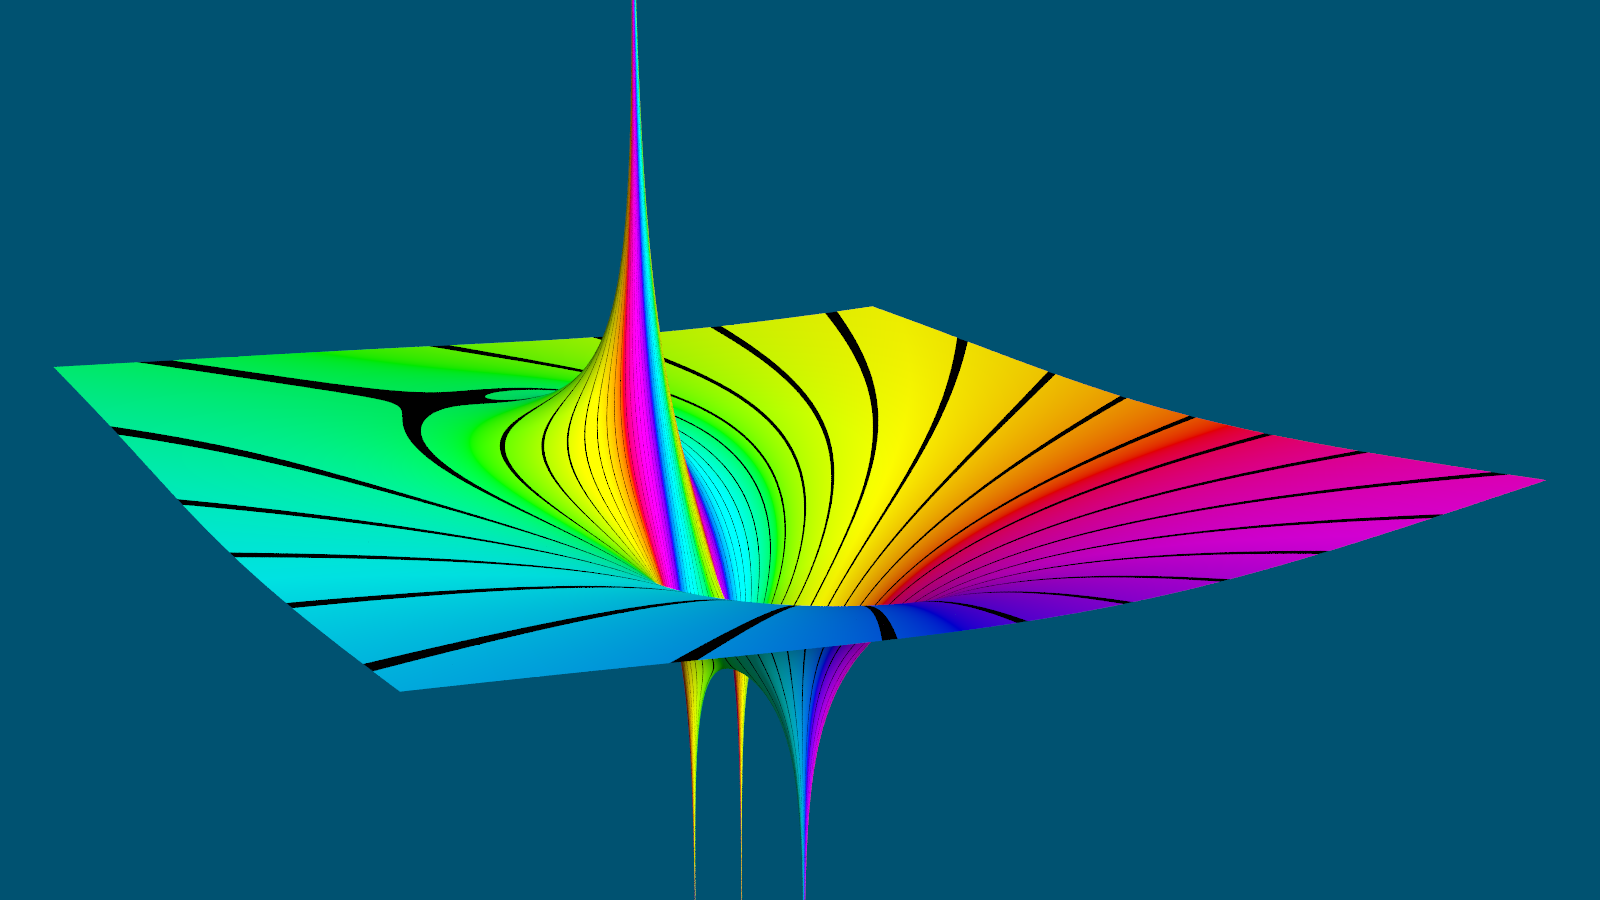
I have now made a couple of rendering of this function with both the natural
logarithm and the base 10 logarithm of the magnitude.
It looks like your rendering was done with the base 10 logarithm. The attached
rendering was done with the natural logarithm.
It seems to me that using a logarithmic scale can sometimes reveal some extra
information also in 3D.
--
Tor Olav
http://subcube.com
https://github.com/t-o-k
Post a reply to this message
Attachments:
Download 'klps function _ ln.png' (244 KB)
Preview of image 'klps function _ ln.png'
|
|
| |
| |
|
|
|
|
| |
| |
|
|
kurtz le pirate <kur### [at] gmailcom> wrote:
>...
> Attached is my latest work with some cosmetic additions.
> The represented function is :
> f(z)= (sin(z) + cos(z)) / (z^2 - iz)
> with Re and Im between -6 and +6.
That is a very nice looking function.
I really like the thin white edges and the small folds/bends at the ends.
The colors also seem to have a pleasant glow.
--
Tor Olav
http://subcube.com
https://github.com/t-o-k
Post a reply to this message
|
|
| |
| |
|
|
|
|
| |
| |
|
|
Thomas de Groot <tho### [at] degrootorg> wrote:
> Somehow, this makes me think of black hole gravity wells...
Yes, and when one plots the logarithm of the magnitude, like Kurtz le pirate
did, the zeros appear like those depicted wells.
> Intriguing!
=)
--
Tor Olav
http://subcube.com
https://github.com/t-o-k
Post a reply to this message
|
|
| |
| |
|
|
|
|
| |