On 27/12/2021 03:46, Tor Olav Kristensen wrote:
> "Tor Olav Kristensen" <tor### [at] TOBEREMOVEDgmail com> wrote:
>> kurtz le pirate <kur### [at] gmailcom> wrote:
>> ...
>>> module(c + id) >> y axis with a logarithmic scale
>>
>> Ok, I see.
>
> What I did not notice was that you've used a logarithmic scale for y-axis.
>
> That could explain the differences. Sorry.
Yes, I used a logarithmic scale for this image.This is really not a good
idea. In fact the use of logarithms comes from my previous frameworks
for visualizing complex functions in 2D.
For the argument, it works fine. For the modulus, you have to take
precautions. Everything depends on the values of the functions you want
to plot. The growth at infinity can be very brutal and you lose a lot of
information with a linear scale ... that's why I used logs. But that was
for 2D ! In 3D now, no need for that.
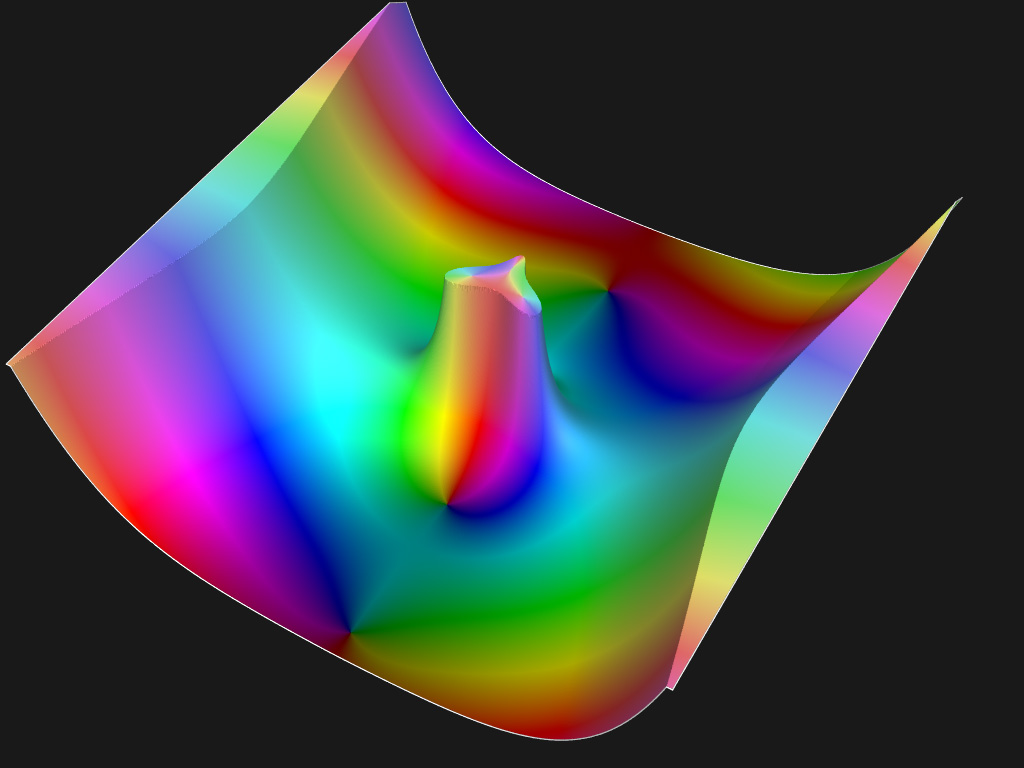
Attached is my latest work with some cosmetic additions.
The represented function is :
f(z)= (sin(z) + cos(z)) / (z^2 - iz)
with Re and Im between -6 and +6.
--
Kurtz le pirate
Compagnie de la Banquise com> wrote:
>> kurtz le pirate <kur### [at] gmailcom> wrote:
>> ...
>>> module(c + id) >> y axis with a logarithmic scale
>>
>> Ok, I see.
>
> What I did not notice was that you've used a logarithmic scale for y-axis.
>
> That could explain the differences. Sorry.
Yes, I used a logarithmic scale for this image.This is really not a good
idea. In fact the use of logarithms comes from my previous frameworks
for visualizing complex functions in 2D.
For the argument, it works fine. For the modulus, you have to take
precautions. Everything depends on the values of the functions you want
to plot. The growth at infinity can be very brutal and you lose a lot of
information with a linear scale ... that's why I used logs. But that was
for 2D ! In 3D now, no need for that.
Attached is my latest work with some cosmetic additions.
The represented function is :
f(z)= (sin(z) + cos(z)) / (z^2 - iz)
with Re and Im between -6 and +6.
--
Kurtz le pirate
Compagnie de la Banquise
Post a reply to this message
Attachments:
Download 'complex3dmesh_fn6.jpg' (91 KB)
Preview of image 'complex3dmesh_fn6.jpg'
|