|
|
|
|
|
|
| |
| |
|
|
|
|
| |
| |
|
|
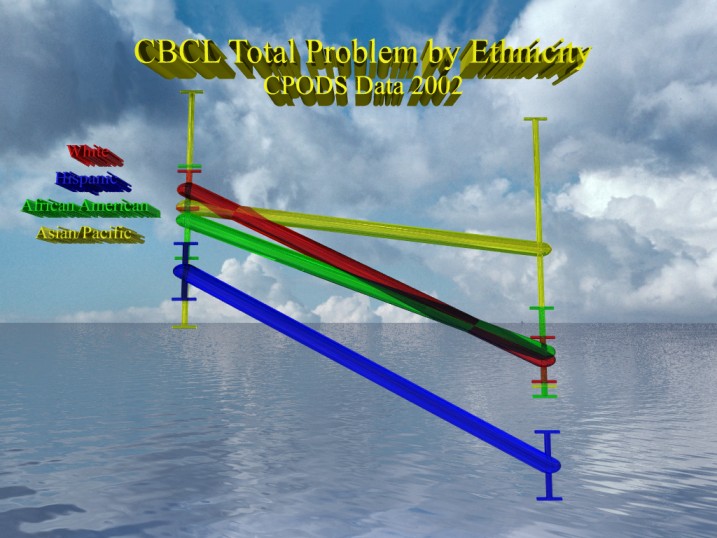
Hello friends.
I'm playing with POV-Ray as a rendering tool for
SPSS. This is a chart looking at change in mental
health scores for children by ethnicity. The slope
lines are drawn with sphere_sweeps.
Problem...
There is a "cross-hatch" artifact where two of
the sphere_sweep bars cross. The red and green
ones. Anyone know why?
TIA,
Harold
Post a reply to this message
Attachments:
Download 'GLMslopechart.jpg' (92 KB)
Preview of image 'GLMslopechart.jpg'
|
|
| |
| |
|
|
From: Sir Charles W Shults III
Subject: Re: Statistical chart with artifact
Date: 10 Jun 2002 20:37:08
Message: <3d054634$1@news.povray.org>
|
|
|
| |
| |
|
|
You are using cylindrical bars, pretty obviously. This "artifact" also
shows up in the red/yellow crossing. Ask yourself a question- what shape is
generated by the merging of two cylinders that are nearly parallel? That is
your answer.
Cheers!
Chip Shults
My robotics, space and CGI web page - http://home.cfl.rr.com/aichip
Post a reply to this message
|
|
| |
| |
|
|
|
|
| |
| |
|
|
> There is a "cross-hatch" artifact where two of
> the sphere_sweep bars cross. The red and green
> ones. Anyone know why?
Because in some parts, the green is in front of the red, and in other parts,
the red is in front of the green. The sphere_sweep that's closer for any
pixel is the one that will dominate the color of that pixel.
- Slime
[ http://www.slimeland.com/ ]
Post a reply to this message
|
|
| |
| |
|
|
|
|
| |
| |
|
|
On Mon, 10 Jun 2002 16:58:37 -0700, "Harold Baize"
<bai### [at] itsa ucsfedu> wrote:
>Problem...
>There is a "cross-hatch" artifact where two of
>the sphere_sweep bars cross. The red and green
>ones. Anyone know why?
Other have given you some good answers on how this is caused. If it
were me, I'd simply move the different lines slightly closer to, or
farther from the camera, to put them on slightly different planes.
That should cure this "fight for dominance"issue.
However, I might be even more concerned that some of your 3-D type is
very hard to read.
Later,
Glen
7no### [at] ezwvcom (Remove the numeral "7") ucsfedu> wrote:
>Problem...
>There is a "cross-hatch" artifact where two of
>the sphere_sweep bars cross. The red and green
>ones. Anyone know why?
Other have given you some good answers on how this is caused. If it
were me, I'd simply move the different lines slightly closer to, or
farther from the camera, to put them on slightly different planes.
That should cure this "fight for dominance"issue.
However, I might be even more concerned that some of your 3-D type is
very hard to read.
Later,
Glen
7no### [at] ezwvcom (Remove the numeral "7")
Post a reply to this message
|
|
| |
| |
|
|
|
|
| |
| |
|
|
Glen Berry wrote:
>
> However, I might be even more concerned that some of your 3-D type is
> very hard to read.
This is my opinion, too. A conventional 2D diagram and - if you insist -
a 3D background would be easier to read. Apart from this, the information
is missing what the left and the right bars signify.
Thomas
Post a reply to this message
|
|
| |
| |
|
|
|
|
| |
| |
|
|
"Sir Charles W. Shults III" <aic### [at] cflrrcom> wrote in message
news:3d054634$1@news.povray.org...
> You are using cylindrical bars, pretty obviously. This "artifact"
also
> shows up in the red/yellow crossing. Ask yourself a question- what shape
is
> generated by the merging of two cylinders that are nearly parallel? That
is
> your answer.
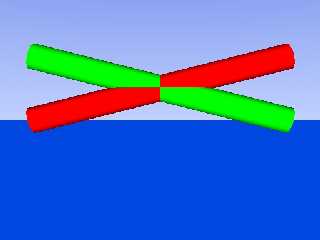
Following what Sir Charles said, this is what two solid cylinders
intersecting look like.
-tgq
Post a reply to this message
Attachments:
Download 'TestIt.JPG' (44 KB)
Preview of image 'TestIt.JPG'
|
|
| |
| |
|
|
|
|
| |
| |
|
|
Yeah, it is not finished, just experimenting. The 3D titles and
legends work better when viewed stereoscopically. Of course
none of that contributes to clarity of communicating data.
It is just for fun. Sometimes I wish the data that I work
with could benefit from a three dimensional representation.
HB
"Thomas Willhalm" <tho### [at] uni-konstanzde> wrote in message
news:3d05d97e@news.povray.org...
> Glen Berry wrote:
> >
> > However, I might be even more concerned that some of your 3-D type is
> > very hard to read.
>
> This is my opinion, too. A conventional 2D diagram and - if you insist -
> a 3D background would be easier to read. Apart from this, the information
> is missing what the left and the right bars signify.
>
> Thomas
Post a reply to this message
|
|
| |
| |
|
|
|
|
| |
| |
|
|
Yeah, now i recognize that I just expected it to
behave differently. Expected a smoother transition.
HB
"TinCanMan" <Tin### [at] hotmailcom> wrote in message
news:3d05e374@news.povray.org...
>
> "Sir Charles W. Shults III" <aic### [at] cflrrcom> wrote in message
> news:3d054634$1@news.povray.org...
> > You are using cylindrical bars, pretty obviously. This "artifact"
> also
> > shows up in the red/yellow crossing. Ask yourself a question- what
shape
> is
> > generated by the merging of two cylinders that are nearly parallel?
That
> is
> > your answer.
>
> Following what Sir Charles said, this is what two solid cylinders
> intersecting look like.
>
> -tgq
>
Post a reply to this message
|
|
| |
| |
|
|
|
|
| |
| |
|
|
"Harold Baize" <bai### [at] itsaucsfedu> wrote in message
news:3d061681@news.povray.org...
> Yeah, it is not finished, just experimenting. The 3D titles and
> legends work better when viewed stereoscopically. Of course
> none of that contributes to clarity of communicating data.
> It is just for fun. Sometimes I wish the data that I work
> with could benefit from a three dimensional representation.
I suggest reducing the extrusion depth to a readable level.
-tgq
Post a reply to this message
|
|
| |
| |
|
|
|
|
| |
| |
|
|
On Mon, 10 Jun 2002 16:58:37 -0700, Harold Baize wrote:
>
> Hello friends.
> I'm playing with POV-Ray as a rendering tool for
> SPSS. This is a chart looking at change in mental
> health scores for children by ethnicity. The slope
> lines are drawn with sphere_sweeps.
> Problem...
> There is a "cross-hatch" artifact where two of
> the sphere_sweep bars cross. The red and green
> ones. Anyone know why?
Don't use cylinders/sphere sweeps, sharp edged rectangles, then you'll
get a merged colour at the intersections, just round the ends off with
a macro or something. And like others said make the text flatter.
--
sphere{z*5,1pigment{rgb.5}finish{reflection.3specular.5}}box{<-50,-3,-50>
<50,-2,50>pigment{checker/*\__\\__/ * \_\\__*/scale 2}finish{ambient.7}}
light_source/*__\\__\\__\\__\\__\( ~ )\__\\__\\__\\__\\*/{<2,5,1>*4,1}
/*\\__\\__\\__\\__\\__\\__\\__\\__\~ -/__\\__\\__\\__\\__\\*//* Steve */
Post a reply to this message
|
|
| |
| |
|
|
|
|
| |