Hello friends.
I'm playing with POV-Ray as a rendering tool for
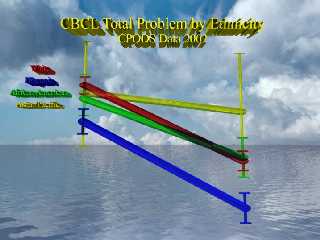
SPSS. This is a chart looking at change in mental
health scores for children by ethnicity. The slope
lines are drawn with sphere_sweeps.
Problem...
There is a "cross-hatch" artifact where two of
the sphere_sweep bars cross. The red and green
ones. Anyone know why?
TIA,
Harold
Post a reply to this message
Attachments:
Download 'GLMslopechart.jpg' (92 KB)
Preview of image 'GLMslopechart.jpg'

|


![]()