|
 |
Moon47 <rdm### [at] earthlink net> wrote:
: I would ask you to explain... But a sample scene/code of the math described would
: be nice to learn from... Maybe a little explanation... My math is not that
: extensive...
You mean about the Mandelbrot set I was talking about?
Ok. Be warned: This is long.
Let me repeat the idea:
For each value in the complex plane (ie. for each a+bi) do the following:
- Raise the value to the power of 2 and add the original value to it.
- Do this an infinite number of times.
- See if the absolute value of the number tends towards infinity (it is
said that the Mandelbrot set has an attractor point at infinity; other
fractals (like magnet1m) can have attractors at other locations as well).
- If the value tends towards infinity we define that this point does not
belong to the set.
- If the value does not tend towards infinity but will always have small
values forever, we define that this point belongs to the set.
Because we can't handle infinity in computers (we can't repeat anything an
infinite number of times nor we can we compare anything to infinity) we have
to make approximations. Luckily enough the approximations we have to make
give us a very good result.
First approximation: It's rather easy to prove mathematically, that if
the value ever goes outside a circle of radius 2 (ie. the absolute value
of the point is bigger than 2), it will never come back inside that circle
but it will rapidly approach infinity (at squared "speed"). Thus, it's enough
to test whether the point ever goes outside that circle or not (ie. we test
whether its absolute value is ever larger than 2).
Side note: This proof also says us that all the points in the set are located
inside a circle of radius 2 and none is outside it.
Second approximation: Since we can't iterate this process an infinite number
of times, we have to iterate it a finite number of times (big surprise). The
number of iterations we make will make the result more accurate. Luckily at
low zoom levels we don't have to make too many iterations (less than 100
iterations is more than enough). If we zoom very deep into the image we have
to use a larger number of iterations (going up to tens of thousands before
the accuracy of floating point numbers is not enough to zoom more).
We have even more luck: The complex plane is 2-dimensional and so is our
screen, so visualizing the complex plane is very easy. We can think of
every pixel in our screen as a number in the complex plane.
Now we only have to write a code that draws us this set.
First we have to decide how we represent the points in the set and the
points not in the set. We can use several methods for this, but for
simplicity let's just color the points in the set black and the points not
in the set colored.
A very interesting effect can be achieved by coloring the points not in
the set according to the number of iterations we had to make to decide that
that point was not in the set.
This not only gives us a visually appealing result, but has a very
informative task. The different bands of color show us where the "hidden"
details of the set are located. By "hidden" I refer to those parts of the
set that are so small that they do not show up due to the coarse resolution
of the screen (or whatever plane we are drawing to). This is due to the
fact that the closer to the set the starting point is, the longer it will
take for it to escape the circle; thus, the color will tell us, how close
or how far the point is to the set compared to the other points nearby.
Also because there are no points of the set outside the circle of radius 2,
we can limit our complex plane to something approximately from -2-2i to 2+2i.
If we are using a programming language that directly supports complex
number math, our task is easier. However, if the language doesn't support
it, we have to code the complex number math "by hand".
I will use povray code here because it's the natural choice for this
group (and news server). Megapov supports complex math, but povray 3.1
doesn't. I will, however, use povray 3.1 code because I don't want to
assume that everyone is using megapov. It will also help to show how to
code this with other languages which lack complex number support.
For this, we will need to know something about complex number math.
The Mandelbrot function was basically this:
For each c in C (the complex number set):
Z(0) = c
Z(n+1) = Z(n)^2 + c
Since complex numbers have to dimensions we have to use two real numbers
to represent a complex number. These two values are the real part and the
imaginary part of the complex number.
The sum of two complex numbers is easy:
a+bi + c+di = (a+c) + (b+d)i
For the power of 2 we just multiply the number by itself. It's calculated:
(a+bi)*(a+bi) = (a^2-b^2) + (2*a*b)i
If you don't know where does that come from, try solving that multiplication
at the left (remember that i^2 = -1).
We also need the absolute value of the complex number. It's:
abs(a+bi) = sqrt(a^2+b^2)
Since we are using it to compare it to 2, ie. we make the comparison:
sqrt(a^2+b^2) < 2
we can raise this inequation to the power of 2 without the truth of it
being modified so we get a more efficient version of the comparison:
a^2+b^2 < 4
Now this is all we need. Let's code.
First let's code the part "for each number in the complex plane", limiting
it from -2-2i to 2+2i:
#declare I = -2;
#while(I <= 2)
#declare R = -2;
#while(R <= 2)
(Here the code that calculates the point R+Ii)
#declare R = R+.05;
#end
#declare I = I+.05;
#end
You can change the resolution of the result by changing those +.05's. The
current value is a rather good compromise between accuracy and (parsing)
speed.
Now we have to code the central part, which decides whether R+Ii is in
the set or not and draws a point according to that. As points we'll just
use colored spheres.
Now we have to iterate a certain number of times. Let's iterate 30 times,
which is in this case more than enough.
We also need a temporary complex number variable (ie. a real number pair)
for the calculation. Let's call the pair Zr and Zi. To simplify coding let's
also use the variables Zr2 to denote Zr^2 and Zi2 to denote Zi^2 (we need
those values in two places and it makes it easier).
#declare Zr = R; #declare Zr2 = Zr*Zr;
#declare Zi = I; #declare Zi2 = Zi*Zi;
#declare iters = 0;
#while(iters < 30 & Zr2+Zi2 <= 4)
(calculate the Z(n+1)=Z(n)^2+c part here)
#declare Zr2 = Zr*Zr;
#declare Zi2 = Zi*Zi;
#declare iters = iters+1;
#end
#declare Col = iters/29;
sphere
{ <R, I, 0>, .1
pigment { rgb (iters=30 ? 0 : <Col, Col, (1-Col)/2>) }
finish { ambient 1 }
}
So what does this do?
The first value of Z is set to c (ie R+Ii in this case) as described in
the function.
Then we make a loop of at max 30 iterations which also ends if the point
being calculated goes outside the circle of radius 2.
After the loop we create a sphere at the location <R, I, 0>. Its color
is black if the point didn't go outside the circle ('iters' got its max value
of 30) and a blue-to-yellow color if it did.
Now we only need the central part. Adapting the algorithm described earlier
we write:
#declare Zi = 2*Zr*Zi + I;
#declare Zr = Zr2-Zi2 + R;
(Note that Zi is calculated first because it has to use the old value of
Zr; if we had calculated Zr first, its old value would have been destroyed.)
Putting all this together we get:
camera { location -z*3 look_at 0 }
#declare I = -2;
#while(I <= 2)
#declare R = -2;
#while(R <= 2)
#declare Zr = R; #declare Zr2 = Zr*Zr;
#declare Zi = I; #declare Zi2 = Zi*Zi;
#declare iters = 0;
#while(iters < 30 & Zr2+Zi2 <= 4)
#declare Zi = 2*Zr*Zi + I;
#declare Zr = Zr2-Zi2 + R;
#declare Zr2 = Zr*Zr;
#declare Zi2 = Zi*Zi;
#declare iters = iters+1;
#end
#declare Col = iters/29;
sphere
{ <R, I, 0>, .1
pigment { rgb (iters=30 ? 0 : <Col, Col, (1-Col)/2>) }
finish { ambient 1 }
}
#declare R = R+.05;
#end
#declare I = I+.05;
#end
And when rendered, we get: net> wrote:
: I would ask you to explain... But a sample scene/code of the math described would
: be nice to learn from... Maybe a little explanation... My math is not that
: extensive...
You mean about the Mandelbrot set I was talking about?
Ok. Be warned: This is long.
Let me repeat the idea:
For each value in the complex plane (ie. for each a+bi) do the following:
- Raise the value to the power of 2 and add the original value to it.
- Do this an infinite number of times.
- See if the absolute value of the number tends towards infinity (it is
said that the Mandelbrot set has an attractor point at infinity; other
fractals (like magnet1m) can have attractors at other locations as well).
- If the value tends towards infinity we define that this point does not
belong to the set.
- If the value does not tend towards infinity but will always have small
values forever, we define that this point belongs to the set.
Because we can't handle infinity in computers (we can't repeat anything an
infinite number of times nor we can we compare anything to infinity) we have
to make approximations. Luckily enough the approximations we have to make
give us a very good result.
First approximation: It's rather easy to prove mathematically, that if
the value ever goes outside a circle of radius 2 (ie. the absolute value
of the point is bigger than 2), it will never come back inside that circle
but it will rapidly approach infinity (at squared "speed"). Thus, it's enough
to test whether the point ever goes outside that circle or not (ie. we test
whether its absolute value is ever larger than 2).
Side note: This proof also says us that all the points in the set are located
inside a circle of radius 2 and none is outside it.
Second approximation: Since we can't iterate this process an infinite number
of times, we have to iterate it a finite number of times (big surprise). The
number of iterations we make will make the result more accurate. Luckily at
low zoom levels we don't have to make too many iterations (less than 100
iterations is more than enough). If we zoom very deep into the image we have
to use a larger number of iterations (going up to tens of thousands before
the accuracy of floating point numbers is not enough to zoom more).
We have even more luck: The complex plane is 2-dimensional and so is our
screen, so visualizing the complex plane is very easy. We can think of
every pixel in our screen as a number in the complex plane.
Now we only have to write a code that draws us this set.
First we have to decide how we represent the points in the set and the
points not in the set. We can use several methods for this, but for
simplicity let's just color the points in the set black and the points not
in the set colored.
A very interesting effect can be achieved by coloring the points not in
the set according to the number of iterations we had to make to decide that
that point was not in the set.
This not only gives us a visually appealing result, but has a very
informative task. The different bands of color show us where the "hidden"
details of the set are located. By "hidden" I refer to those parts of the
set that are so small that they do not show up due to the coarse resolution
of the screen (or whatever plane we are drawing to). This is due to the
fact that the closer to the set the starting point is, the longer it will
take for it to escape the circle; thus, the color will tell us, how close
or how far the point is to the set compared to the other points nearby.
Also because there are no points of the set outside the circle of radius 2,
we can limit our complex plane to something approximately from -2-2i to 2+2i.
If we are using a programming language that directly supports complex
number math, our task is easier. However, if the language doesn't support
it, we have to code the complex number math "by hand".
I will use povray code here because it's the natural choice for this
group (and news server). Megapov supports complex math, but povray 3.1
doesn't. I will, however, use povray 3.1 code because I don't want to
assume that everyone is using megapov. It will also help to show how to
code this with other languages which lack complex number support.
For this, we will need to know something about complex number math.
The Mandelbrot function was basically this:
For each c in C (the complex number set):
Z(0) = c
Z(n+1) = Z(n)^2 + c
Since complex numbers have to dimensions we have to use two real numbers
to represent a complex number. These two values are the real part and the
imaginary part of the complex number.
The sum of two complex numbers is easy:
a+bi + c+di = (a+c) + (b+d)i
For the power of 2 we just multiply the number by itself. It's calculated:
(a+bi)*(a+bi) = (a^2-b^2) + (2*a*b)i
If you don't know where does that come from, try solving that multiplication
at the left (remember that i^2 = -1).
We also need the absolute value of the complex number. It's:
abs(a+bi) = sqrt(a^2+b^2)
Since we are using it to compare it to 2, ie. we make the comparison:
sqrt(a^2+b^2) < 2
we can raise this inequation to the power of 2 without the truth of it
being modified so we get a more efficient version of the comparison:
a^2+b^2 < 4
Now this is all we need. Let's code.
First let's code the part "for each number in the complex plane", limiting
it from -2-2i to 2+2i:
#declare I = -2;
#while(I <= 2)
#declare R = -2;
#while(R <= 2)
(Here the code that calculates the point R+Ii)
#declare R = R+.05;
#end
#declare I = I+.05;
#end
You can change the resolution of the result by changing those +.05's. The
current value is a rather good compromise between accuracy and (parsing)
speed.
Now we have to code the central part, which decides whether R+Ii is in
the set or not and draws a point according to that. As points we'll just
use colored spheres.
Now we have to iterate a certain number of times. Let's iterate 30 times,
which is in this case more than enough.
We also need a temporary complex number variable (ie. a real number pair)
for the calculation. Let's call the pair Zr and Zi. To simplify coding let's
also use the variables Zr2 to denote Zr^2 and Zi2 to denote Zi^2 (we need
those values in two places and it makes it easier).
#declare Zr = R; #declare Zr2 = Zr*Zr;
#declare Zi = I; #declare Zi2 = Zi*Zi;
#declare iters = 0;
#while(iters < 30 & Zr2+Zi2 <= 4)
(calculate the Z(n+1)=Z(n)^2+c part here)
#declare Zr2 = Zr*Zr;
#declare Zi2 = Zi*Zi;
#declare iters = iters+1;
#end
#declare Col = iters/29;
sphere
{ <R, I, 0>, .1
pigment { rgb (iters=30 ? 0 : <Col, Col, (1-Col)/2>) }
finish { ambient 1 }
}
So what does this do?
The first value of Z is set to c (ie R+Ii in this case) as described in
the function.
Then we make a loop of at max 30 iterations which also ends if the point
being calculated goes outside the circle of radius 2.
After the loop we create a sphere at the location <R, I, 0>. Its color
is black if the point didn't go outside the circle ('iters' got its max value
of 30) and a blue-to-yellow color if it did.
Now we only need the central part. Adapting the algorithm described earlier
we write:
#declare Zi = 2*Zr*Zi + I;
#declare Zr = Zr2-Zi2 + R;
(Note that Zi is calculated first because it has to use the old value of
Zr; if we had calculated Zr first, its old value would have been destroyed.)
Putting all this together we get:
camera { location -z*3 look_at 0 }
#declare I = -2;
#while(I <= 2)
#declare R = -2;
#while(R <= 2)
#declare Zr = R; #declare Zr2 = Zr*Zr;
#declare Zi = I; #declare Zi2 = Zi*Zi;
#declare iters = 0;
#while(iters < 30 & Zr2+Zi2 <= 4)
#declare Zi = 2*Zr*Zi + I;
#declare Zr = Zr2-Zi2 + R;
#declare Zr2 = Zr*Zr;
#declare Zi2 = Zi*Zi;
#declare iters = iters+1;
#end
#declare Col = iters/29;
sphere
{ <R, I, 0>, .1
pigment { rgb (iters=30 ? 0 : <Col, Col, (1-Col)/2>) }
finish { ambient 1 }
}
#declare R = R+.05;
#end
#declare I = I+.05;
#end
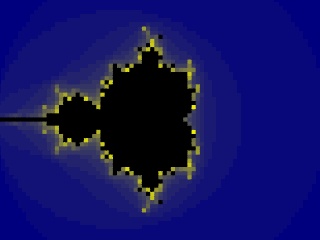
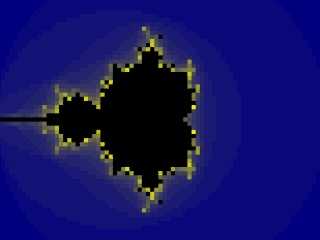
And when rendered, we get:
Post a reply to this message
Attachments:
Download 'mand.jpg' (14 KB)
Preview of image 'mand.jpg'
|
|
|
|
Show off!
Really smothe caustics and some great refraction. Did you use area
lights to get the transition from caustic to plain light so smooth?
--
Cheers
Steve email mailto:ste### [at] zeroppsuklinuxnet
%HAV-A-NICEDAY Error not enough coffee 0 pps.
web http://www.zeropps.uklinux.net/
or http://start.at/zero-pps
6:51pm up 11 days, 18:32, 2 users, load average: 1.15, 1.05, 1.01
Post a reply to this message
|
|
|
|
> Now, this is interesting. For no apparent reason a quite chaotic
pattern
> (with greenish-yellow coloration) has appeared seemingly from nowhere on
the
> sphere at the right of the central sphere. Its appearance there is quite
> mysterious. Well, not really the appearance, but its chaotic nature. I
> guess that it may be caused by refraction of one or several caustics, but
> its chaotic pattern is just inexplicable.
I think the coloration is the result of these?
The hot spot under each sphere appears to be fairly whitish light which is
hitting
the brown surface. The result is yellowish. Since the adjoining sphere
and the sphere next to that are both directly facing the light source,
there's one spot going onto the ground behind the sphere and another going
somewhat into the sphere. The result of seeing the yellowish spots through
blue glass is green, like the Ziploc ad.
The thing I don't get is how so much of the ground is being seen through
that particular sphere when all the others are fairly opaque due to the
high reflectivity.
So maybe I'm just wrong. It does look pretty 'swirly', like the pic with
the media inside crystals. Could the swirliness be from reflecting the
clouds?
Post a reply to this message
|
|