|
 |
I think I was playing around with the AI again, and the simplest function caught
my eye.
Slumbering neurons were roused, and I realized that although I didn't have
access to POV-Ray, I _did_ have access to Desmos.
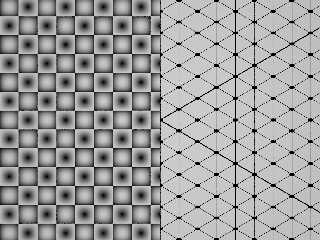
Graphing cos(x) * sin (y) revealed a very surprising pattern, and I did a little
bit of follow-up development from there. Subtracting a constant in between 0
and 1 changes the pattern from circles, to squircles, to squares.
So then, I had to transition between simple graphing, and mapping equations to a
plane with functions. I had a surprisingly difficult time getting the lines to
match the dots at the proper slopes, and I had to introduce fudge factors to get
the lines to accurately match the frequency of the dots.
Blah blah blah - here's the original basic pattern and the triangular grid that
I made based on that.
I also needed to alter my fmod function, and I still need to add another level
of select () to fix the doubling of the lines across N=0.
Post a reply to this message
Attachments:
Download 'mathpatterns2.png' (321 KB)
Preview of image 'mathpatterns2.png'

|
 |


![]()