|
 |
In article <bxgJOUQlwRAZjNon5CpBS1iEe=yq@4ax.com>, Glen Berry
<7no### [at] ezwv com> wrote:
> I have attached my recreation of your effect. I have also included
> pictures of curves that represent what I did to the tonal range of the
> image, labeled "before" and "after." In keeping with my earlier
> listing of formulas for such effects, here are the formulas used:
>
> Rout = (Rin*1.6)-0.3
> Gout = (Gin*1.6)-0.3
> Bout = (Bin*1.6)-0.3
Hmm, so it could be done by using these two filters in order:
multiply {rgb 1.6}
add {rgb -0.3}
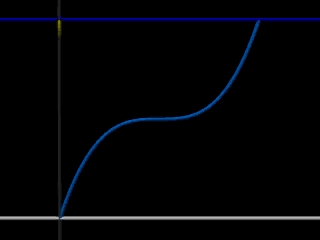
Hmm, I think a different but very similar effect could be done by using
a polynomial curve. Something like this would enhance either the lower
or the upper ranges, depending on val, and would be centered around 0.5:
for rgb values below 0.5:
R = 0.5*(abs(2*r-1)^val) + 0.5;
G = 0.5*(abs(2*g-1)^val) + 0.5;
B = 0.5*(abs(2*b-1)^val) + 0.5;
for rgb values above 0.5:
R = 0.5 - 0.5*(abs(2*r-1)^val);
G = 0.5 - 0.5*(abs(2*g-1)^val);
B = 0.5 - 0.5*(abs(2*b-1)^val);
This would give a smooth curve rather than a clipped linear effect. See
the attached image.
> If this sort of effect is what you want, it can be achieved with
> "iso-functions" applied to tonal response.
Nearly anything could be accomplished with isofunctions, I will have to
take a closer look at the source to see how to implement it.
--
Christopher James Huff - Personal e-mail: chr### [at] yahoocom
TAG(Technical Assistance Group) e-mail: chr### [at] tagpovrayorg
Personal Web page: http://chrishuff.dhs.org/
TAG Web page: http://tag.povray.org/ com> wrote:
> I have attached my recreation of your effect. I have also included
> pictures of curves that represent what I did to the tonal range of the
> image, labeled "before" and "after." In keeping with my earlier
> listing of formulas for such effects, here are the formulas used:
>
> Rout = (Rin*1.6)-0.3
> Gout = (Gin*1.6)-0.3
> Bout = (Bin*1.6)-0.3
Hmm, so it could be done by using these two filters in order:
multiply {rgb 1.6}
add {rgb -0.3}
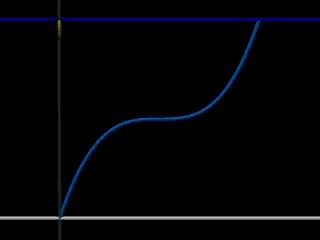
Hmm, I think a different but very similar effect could be done by using
a polynomial curve. Something like this would enhance either the lower
or the upper ranges, depending on val, and would be centered around 0.5:
for rgb values below 0.5:
R = 0.5*(abs(2*r-1)^val) + 0.5;
G = 0.5*(abs(2*g-1)^val) + 0.5;
B = 0.5*(abs(2*b-1)^val) + 0.5;
for rgb values above 0.5:
R = 0.5 - 0.5*(abs(2*r-1)^val);
G = 0.5 - 0.5*(abs(2*g-1)^val);
B = 0.5 - 0.5*(abs(2*b-1)^val);
This would give a smooth curve rather than a clipped linear effect. See
the attached image.
> If this sort of effect is what you want, it can be achieved with
> "iso-functions" applied to tonal response.
Nearly anything could be accomplished with isofunctions, I will have to
take a closer look at the source to see how to implement it.
--
Christopher James Huff - Personal e-mail: chr### [at] yahoocom
TAG(Technical Assistance Group) e-mail: chr### [at] tagpovrayorg
Personal Web page: http://chrishuff.dhs.org/
TAG Web page: http://tag.povray.org/
Post a reply to this message
Attachments:
Download 'GraphFunc.jpg' (11 KB)
Preview of image 'GraphFunc.jpg'
|
|