On 3/1/25 11:24, Tor Olav Kristensen wrote:
> But I can't figure out how to interpret the two bottom graphs in the
> attached images.
I'm uncomfortable with how to represent the derivative graphs where they
turn completely or partially constant.
I needed to normalize returned u,v values to get the scales into
somewhat similar ranges for viewing - which corrupts them some too. The
derivative plots sometimes end up being sets of values more the any sort
of curve. We are looking at spheres at u,v locations.
On the lower left in white are the first derivative x,y points as
spheres. The yellow is the second derivative and here all the values
overlap the y axis.
On the right the purple spheres are the completely constant x,y second
derivative values returned. The spheres are all at the same location.
---
While working on the code for these inbuilt functions I set up some
plots using isosurfaces to graph where I took care to align the 'x' and
't' values while evenly spacing the control points. For me these plots
make more intuitive sense because I can plot v vs u. Let me see if I
still have some of those around...
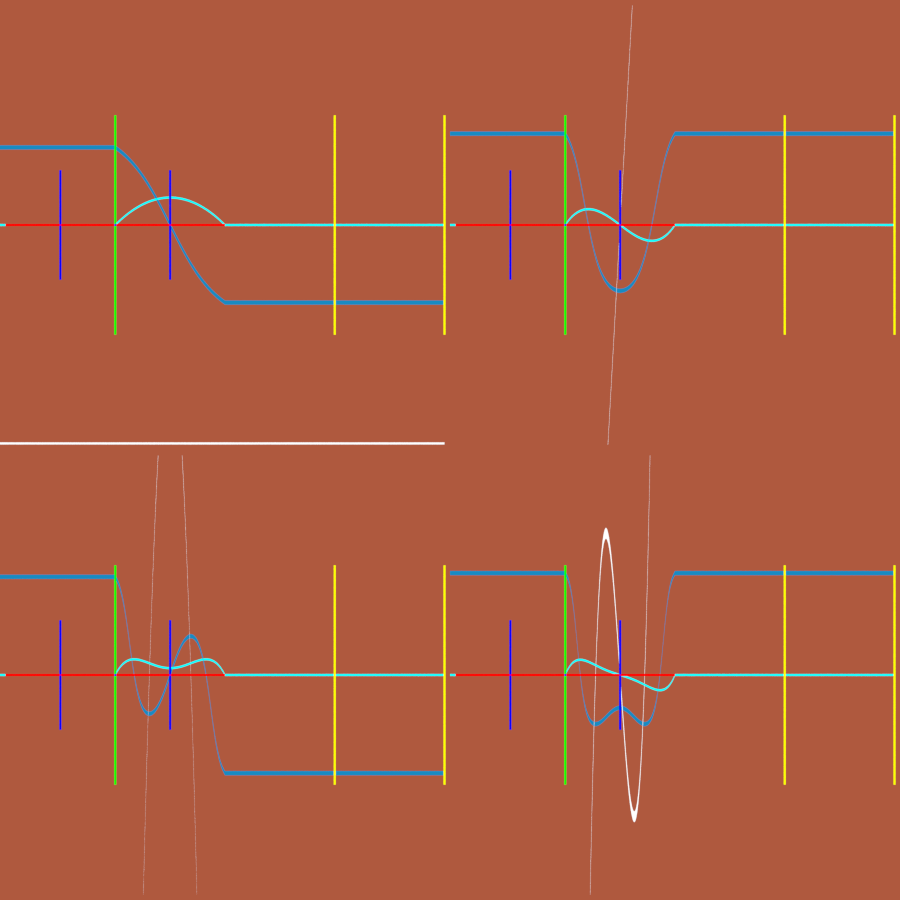
Found one. Quadratic, Cubic on the top. Quartic, Quintic on the bottom.
The cyan is the Bezier curve itself. The slate blue is the normalized
derivative. The white the second derivative - where it crosses the u
axis at y==zero we have the inflection points of the first derivative curve.
Aside: Thanks for your post on Jean Gallier's online material. I made a
note of it. I have a hard copy of that curves and surfaces book. I found
it, less immediately useful than I'd hoped - because I'm a maths hack. :-)
Bill P.
Post a reply to this message
Attachments:
Download 'f_bezier_2d_n2n3n4_and_n5.png' (93 KB)
Preview of image 'f_bezier_2d_n2n3n4_and_n5.png'
|