|
|
|
|
|
|
| |
| |
|
|
|
|
| |
| |
|
|
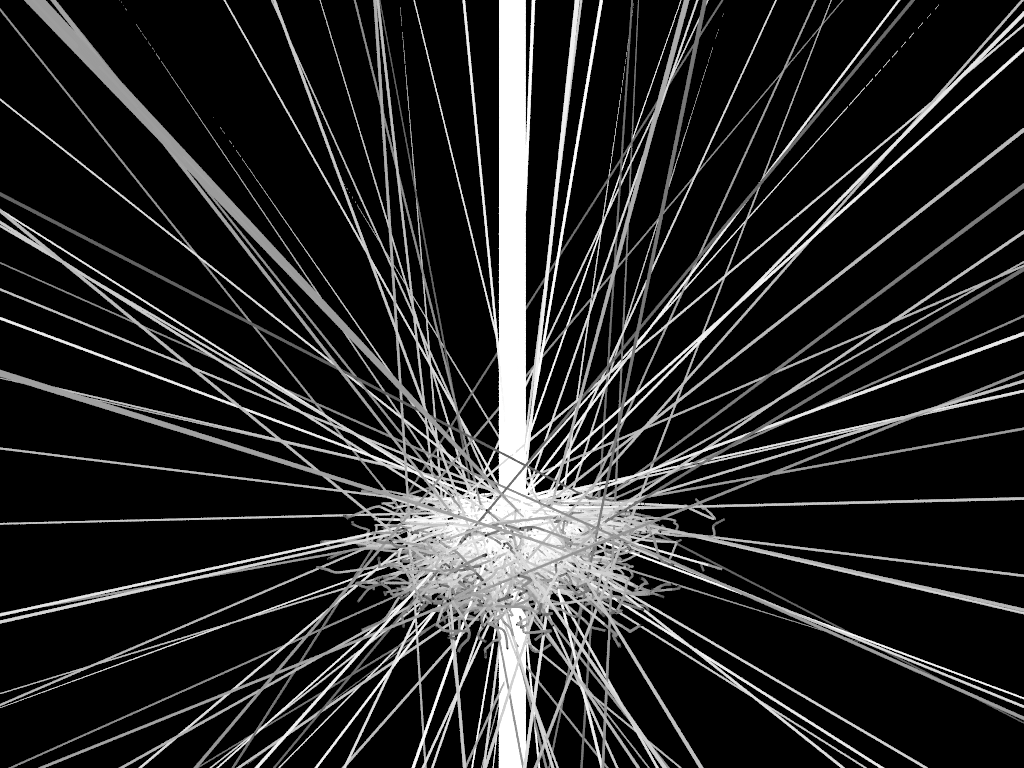
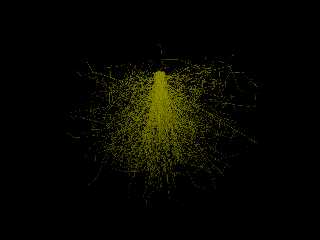
Added the energy parameter to the spreadsheet, and then dabbled with it a bit.
Black background with color in the range from rgb 1 to rgb 0 based on the
energy.
finish {specular 0.4 emission 1}}
Best would be to have some representation of the physical sample, though that
data is not provided (but I have a good guess ;) )
Post a reply to this message
Attachments:
Download 'plotcasino.png' (488 KB)
Preview of image 'plotcasino.png'
|
|
| |
| |
|
|
|
|
| |
| |
|
|
"Bald Eagle" <cre### [at] netscape net> wrote:
> Added the energy parameter to the spreadsheet, and then dabbled with it a bit.
>
> Black background with color in the range from rgb 1 to rgb 0 based on the
> energy.
> finish {specular 0.4 emission 1}}
>
> Best would be to have some representation of the physical sample, though that
> data is not provided (but I have a good guess ;) )
I don't have a clue what this is supposed to represent, but it looks like
somebody was trying to place the spokes in a bicycle-wheel, and that went
utterly, completely wrong, obviously!
Cheers
Ton. net> wrote:
> Added the energy parameter to the spreadsheet, and then dabbled with it a bit.
>
> Black background with color in the range from rgb 1 to rgb 0 based on the
> energy.
> finish {specular 0.4 emission 1}}
>
> Best would be to have some representation of the physical sample, though that
> data is not provided (but I have a good guess ;) )
I don't have a clue what this is supposed to represent, but it looks like
somebody was trying to place the spokes in a bicycle-wheel, and that went
utterly, completely wrong, obviously!
Cheers
Ton.
Post a reply to this message
|
|
| |
| |
|
|
|
|
| |
| |
|
|
On 5-5-2019 2:40, Ton wrote:
> "Bald Eagle" <cre### [at] netscapenet> wrote:
>> Added the energy parameter to the spreadsheet, and then dabbled with it a bit.
>>
>> Black background with color in the range from rgb 1 to rgb 0 based on the
>> energy.
>> finish {specular 0.4 emission 1}}
>>
>> Best would be to have some representation of the physical sample, though that
>> data is not provided (but I have a good guess ;) )
>
> I don't have a clue what this is supposed to represent, but it looks like
> somebody was trying to place the spokes in a bicycle-wheel, and that went
> utterly, completely wrong, obviously!
>
LOL, yes indeed! No clues either, but I guess it has to do with magnetic
force lines in a dynamo.
--
Thomas
Post a reply to this message
|
|
| |
| |
|
|
|
|
| |
| |
|
|
Thomas de Groot <tho### [at] degrootorg> wrote:
> On 5-5-2019 2:40, Ton wrote:
> > I don't have a clue what this is supposed to represent, but it looks like
> > somebody was trying to place the spokes in a bicycle-wheel, and that went
> > utterly, completely wrong, obviously!
> >
>
> LOL, yes indeed! No clues either, but I guess it has to do with magnetic
> force lines in a dynamo.
:D
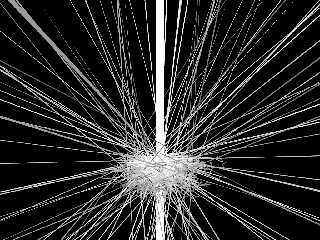
I only did the very briefest of searches to see what the usual plotted data
looks like, and my guess is that it's the results of a mineral analysis where
they shoot a beam of electrons at the surface and somehow measure the path,
which density, and perhaps elemental data (due to energy lost per
collision/deflection).
I added a filter for the very large "out of range" values (I initially plotted
all of the data - it was the simplest and --- that's the data, so that's what
you use) added macro parameters for line thickness and interpolation increments,
and just need to do something with the color.
Post a reply to this message
Attachments:
Download 'plotcasino.png' (200 KB)
Preview of image 'plotcasino.png'
|
|
| |
| |
|
|
|
|
| |
| |
|
|
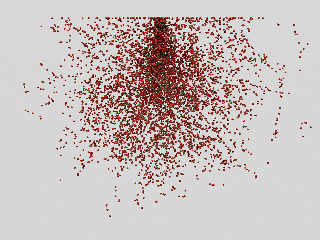
Now, after I plotted out this last one, I realized that it looked like tree
roots, or perhaps if inverted, the crown of a tree.
Now, if the same sort of Monte Carlo method can be used with a starting vector,
then I can envision making simulated neural networks, blood vessels, leaf veins,
lightning, certain bark patterns, insect chew-trails in wood, ....
Post a reply to this message
|
|
| |
| |
|
|
|
|
| |
| |
|
|
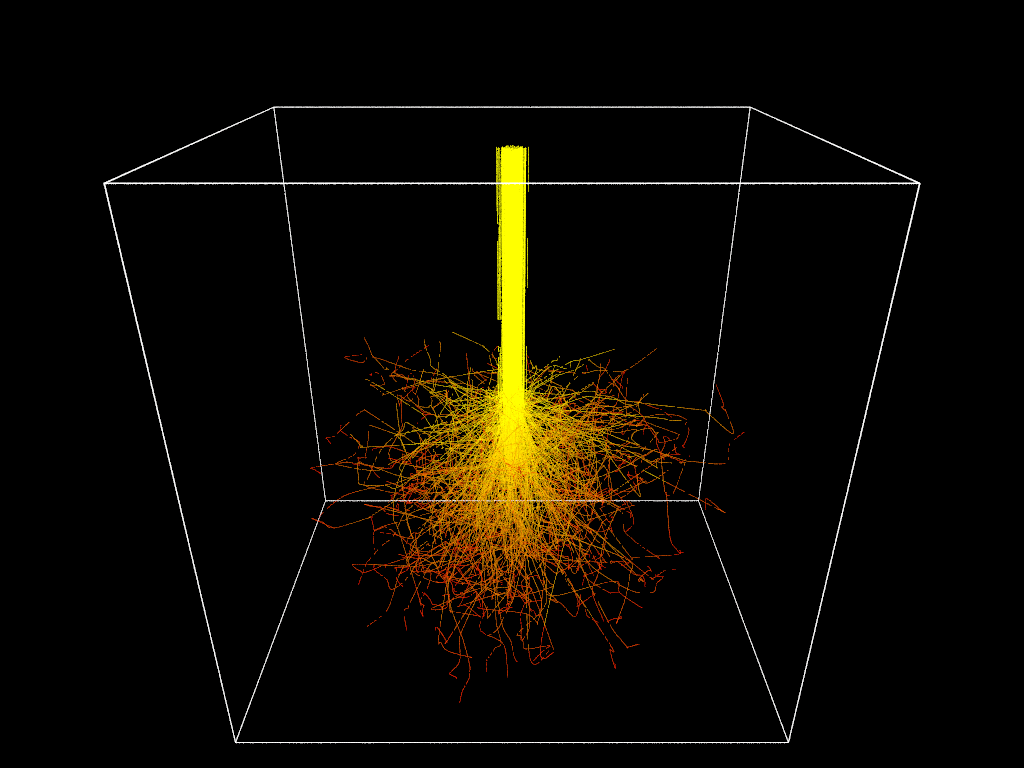
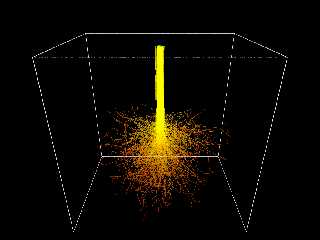
So I fixed the missing y=0 points that I wanted to force into the data set,
skewed the coloration so it looks good, and made it "fade" from yellow to red.
Added a wireframe representing what I thought ought to be the "sample space".
Likely there ought to be tick-marks and a scale denoting the energy-color
equivalence.
Post a reply to this message
Attachments:
Download 'plotcasino.png' (169 KB)
Preview of image 'plotcasino.png'
|
|
| |
| |
|
|
|
|
| |
| |
|
|
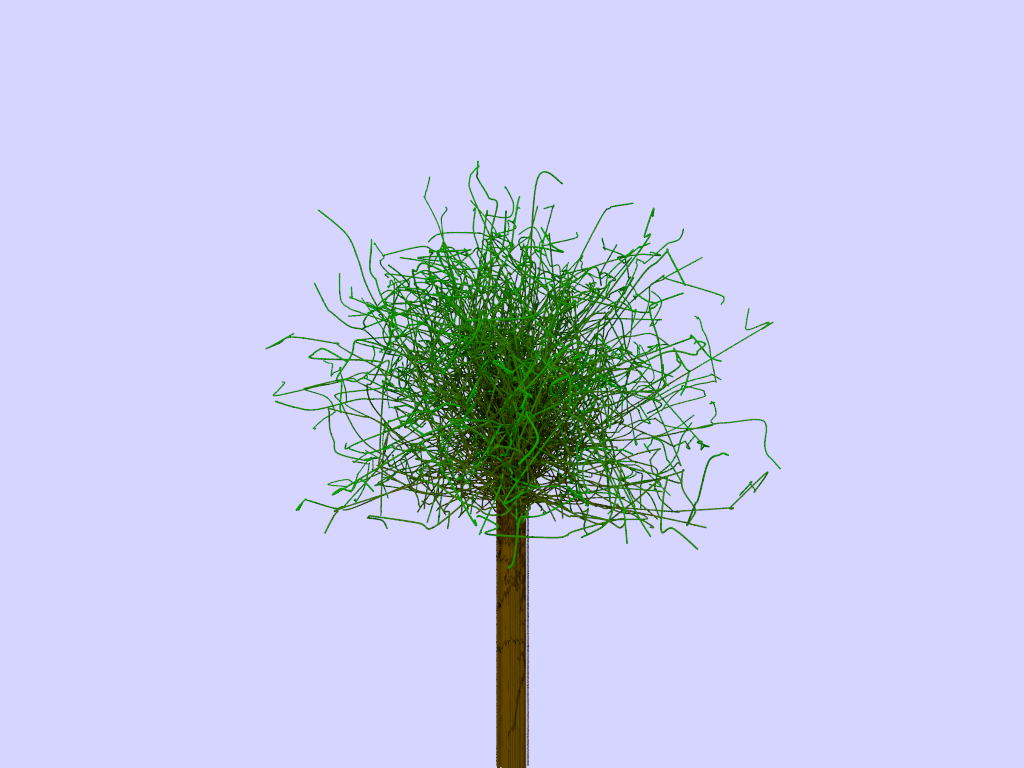
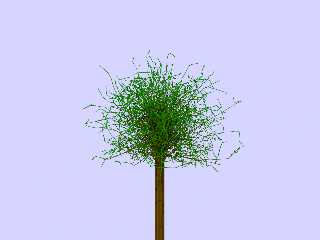
Changed the radius and the color fade, and inverted the whole thing.
The crown minus the bole could be a tuft of grass.
Post a reply to this message
Attachments:
Download 'plotcasino.png' (467 KB)
Preview of image 'plotcasino.png'
|
|
| |
| |
|
|
|
|
| |
| |
|
|
On 5-5-2019 18:44, Bald Eagle wrote:
> So I fixed the missing y=0 points that I wanted to force into the data set,
> skewed the coloration so it looks good, and made it "fade" from yellow to red.
> Added a wireframe representing what I thought ought to be the "sample space".
>
> Likely there ought to be tick-marks and a scale denoting the energy-color
> equivalence.
>
Very nice indeed. Besides roots and such, this could be a model of oil
fracking: the oil seeping/pumped from the rock fractures, towards the
pipe. Colour showing the yield percentage. ;-)
--
Thomas
Post a reply to this message
|
|
| |
| |
|
|
|
|
| |
| |
|
|
"Bald Eagle" <cre### [at] netscapenet> wrote:
> So I fixed the missing y=0 points that I wanted to force into the data set,
> skewed the coloration so it looks good, and made it "fade" from yellow to red.
> Added a wireframe representing what I thought ought to be the "sample space".
>
> Likely there ought to be tick-marks and a scale denoting the energy-color
> equivalence.
Hi,
I'm impressed, because I'm clueless how you got cylinder data out of this point
data. I was only able to process the data like this -
//"Trajectory", 0
// Backscattered
sphere {<0.388359, 0.155002, -5248 >, r1 rotate x*90 material {T1}}
sphere {<0.123702, -0.142302, 10 >, r1 rotate x*90 material {T1}}
sphere {<0.123548, -0.142474, 13.0554 >, r1 rotate x*90 material {T1}}
sphere {<-2.19331, -3.08246, 10.8394 >, r1 rotate x*90 material {T1}}
sphere {<-2.18082, -3.25931, 10.5336 >, r1 rotate x*90 material {T1}}
sphere {<-2.19314, -3.36231, 10.2358 >, r1 rotate x*90 material {T1}}
sphere {<-2.23197, -3.40002, 10 >, r1 rotate x*90 material {T1}}
sphere {<-868.239, -844.603, -5250 >, r1 rotate x*90 material {T1}}
sphere {<-2472.91, -2403.32, -14996.6 >, r1 rotate x*90 material {T1}}
So, how you made it?
Regards
Norbert
Post a reply to this message
Attachments:
Download '0p5kvsio2f_a.jpg' (655 KB)
Preview of image '0p5kvsio2f_a.jpg'
|
|
| |
| |
|
|
|
|
| |
| |
|
|
"Norbert Kern" <nor### [at] t-onlinede> wrote:
> Hi,
> I'm impressed, because I'm clueless how you got cylinder data out of this point
> data. I was only able to process the data like this -
Well, thanks, but my parlour trick is quite simple.
I used LibreOffice Calc to "wrap" the data points in arrays, that are collected
in the one big array.
#declare Trajectories = array [400] {
array [9] {
<0.388359, 0.155002, -5248, 0.5>,
<0.123702, -0.142302, 10, 0.5>,
<0.123548, -0.142474, 13.0554, 0.425623495431>,
<-2.19331, -3.08246, 10.8394, 0.310653718134>,
<-2.18082, -3.25931, 10.5336, 0.299795342749>,
<-2.19314, -3.36231, 10.2358, 0.289950323491>,
<-2.23197, -3.40002, 10, 0.282284373755>,
<-868.239, -844.603, -5250, 0.282284373755>,
<-2472.91, -2403.32, -14996.6, 0.282284373755>,
}
.... etc
}
I did a little bit of finagling to drop any points that are +/- some
user-defined maximum (thus getting rid of the wild "spokes".
Then I looped through the 400 sub-arrays and generated a cubic spline for each
of them. I just duplicate the first and last data points, but offset them from
the ends of the spline to give me the control points. All the rest of the data
points are just shifted up on increment so I can wedge the [formally
nonexistent] y=0 points into the spline.
Using that spline, I do just what you do - make spheres, but I step through the
spline in 0.005 increments - so it's like a sphere sweep.
I fade the pigment using
#local C = pow(Array [ctr*N].filter,2)*4*<1, 1, 0> + (0.5-Array
[ctr*N].filter)*2*<1, 0, 0>;
and then use pigment { color C }.
I'm kind of interested in what the OP's finished product will look like.
Hopefully it's not just a grab-and-run. ;)
I can post the code in the scene file section if you'd like, and I guess I'd
have to email you the spreadsheet. That was really the hardest hair-pulling
part, since I was out of practice. ;)
Post a reply to this message
|
|
| |
| |
|
|
|
|
| |
|
|