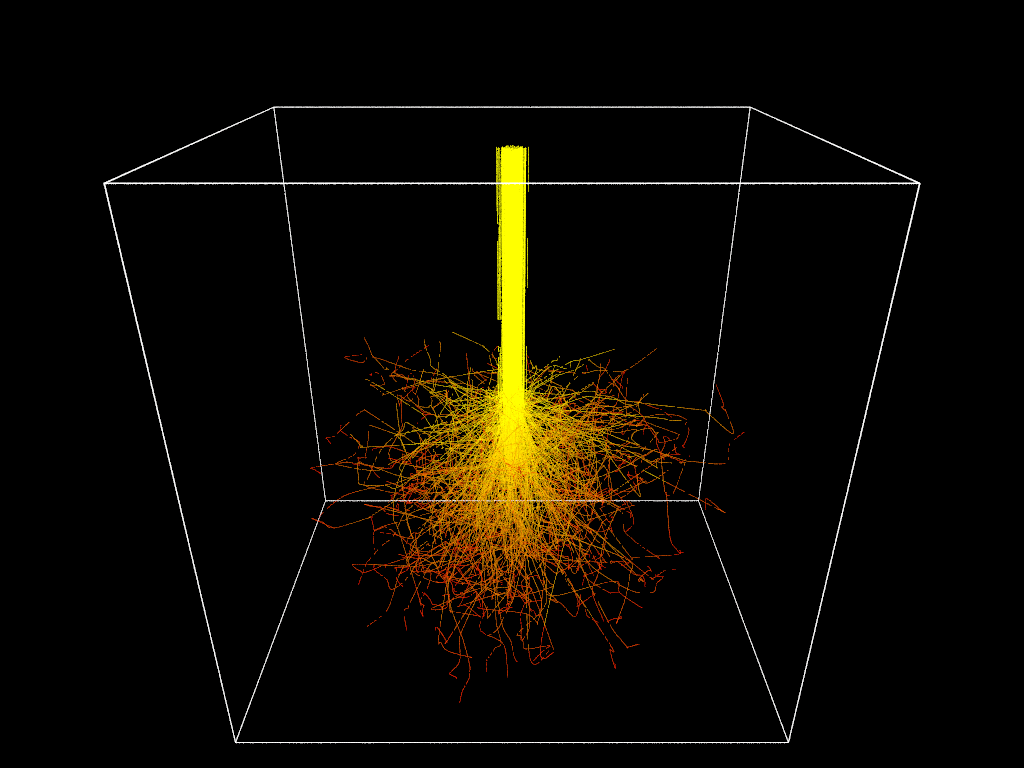
So I fixed the missing y=0 points that I wanted to force into the data set,
skewed the coloration so it looks good, and made it "fade" from yellow to red.
Added a wireframe representing what I thought ought to be the "sample space".
Likely there ought to be tick-marks and a scale denoting the energy-color
equivalence.
Post a reply to this message
Attachments:
Download 'plotcasino.png' (169 KB)
Preview of image 'plotcasino.png'
|