|
 |
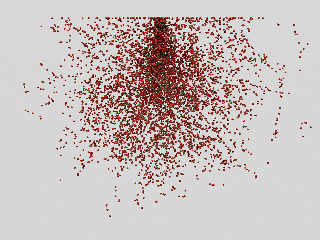
"Bald Eagle" <cre### [at] netscape net> wrote:
> So I fixed the missing y=0 points that I wanted to force into the data set,
> skewed the coloration so it looks good, and made it "fade" from yellow to red.
> Added a wireframe representing what I thought ought to be the "sample space".
>
> Likely there ought to be tick-marks and a scale denoting the energy-color
> equivalence.
Hi,
I'm impressed, because I'm clueless how you got cylinder data out of this point
data. I was only able to process the data like this -
//"Trajectory", 0
// Backscattered
sphere {<0.388359, 0.155002, -5248 >, r1 rotate x*90 material {T1}}
sphere {<0.123702, -0.142302, 10 >, r1 rotate x*90 material {T1}}
sphere {<0.123548, -0.142474, 13.0554 >, r1 rotate x*90 material {T1}}
sphere {<-2.19331, -3.08246, 10.8394 >, r1 rotate x*90 material {T1}}
sphere {<-2.18082, -3.25931, 10.5336 >, r1 rotate x*90 material {T1}}
sphere {<-2.19314, -3.36231, 10.2358 >, r1 rotate x*90 material {T1}}
sphere {<-2.23197, -3.40002, 10 >, r1 rotate x*90 material {T1}}
sphere {<-868.239, -844.603, -5250 >, r1 rotate x*90 material {T1}}
sphere {<-2472.91, -2403.32, -14996.6 >, r1 rotate x*90 material {T1}}
So, how you made it?
Regards
Norbert net> wrote:
> So I fixed the missing y=0 points that I wanted to force into the data set,
> skewed the coloration so it looks good, and made it "fade" from yellow to red.
> Added a wireframe representing what I thought ought to be the "sample space".
>
> Likely there ought to be tick-marks and a scale denoting the energy-color
> equivalence.
Hi,
I'm impressed, because I'm clueless how you got cylinder data out of this point
data. I was only able to process the data like this -
//"Trajectory", 0
// Backscattered
sphere {<0.388359, 0.155002, -5248 >, r1 rotate x*90 material {T1}}
sphere {<0.123702, -0.142302, 10 >, r1 rotate x*90 material {T1}}
sphere {<0.123548, -0.142474, 13.0554 >, r1 rotate x*90 material {T1}}
sphere {<-2.19331, -3.08246, 10.8394 >, r1 rotate x*90 material {T1}}
sphere {<-2.18082, -3.25931, 10.5336 >, r1 rotate x*90 material {T1}}
sphere {<-2.19314, -3.36231, 10.2358 >, r1 rotate x*90 material {T1}}
sphere {<-2.23197, -3.40002, 10 >, r1 rotate x*90 material {T1}}
sphere {<-868.239, -844.603, -5250 >, r1 rotate x*90 material {T1}}
sphere {<-2472.91, -2403.32, -14996.6 >, r1 rotate x*90 material {T1}}
So, how you made it?
Regards
Norbert
Post a reply to this message
Attachments:
Download '0p5kvsio2f_a.jpg' (655 KB)
Preview of image '0p5kvsio2f_a.jpg'
|
|


