|
|
|
|
|
|
| |
| |
|
|
|
|
| |
| |
|
|
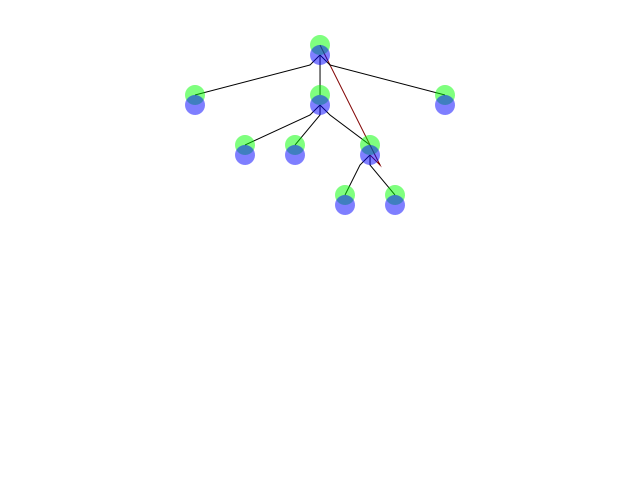
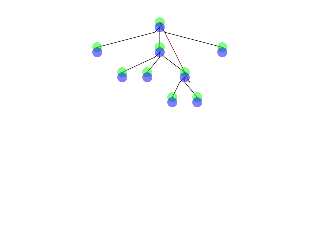
I wrote a program that takes a connection list such as

   [
     (1, n [b 2, b 3, b 4]),
     (2, n []),
     (3, n [b 5, b 6, b 7]),
     (4, n []),
     (5, n []),
     (6, n []),
     (7, n [b 8, b 9, a 1]),
     (8, n []),
     (9, n [])
   ]

and generates an image such as the one attached.

Trouble is... it's not a very good graphic, is it? :-/
Post a reply to this message
Attachments:
Download 'test3.png' (10 KB)
Preview of image 'test3.png'
|
|
| |
| |
|
|
|
|
| |
| |
|
|
You might take a look at GraphViz if you haven't done so already:
http://www.graphviz.org/

I bet you'd find in their papers plenty of ideas to make a better
rendering... Assuming you want to do it by yourself and not just use
existing tools.

--
Vincent
Post a reply to this message
|
|
| |
| |
|
|
|
|
| |
| |
|
|
Vincent Le Chevalier wrote:
> You might take a look at GraphViz if you haven't done so already:
> http://www.graphviz.org/
>
> I bet you'd find in their papers plenty of ideas to make a better
> rendering... Assuming you want to do it by yourself and not just use
> existing tools.

I did take a look at the "dot" tool - but it tends to produce utterly
horrid graphs. I mean, *astonishingly* bad graphs.

So I set about attempting to write my own. But, while it does strictly
speaking _work_, it leaves a lot to be desired. (A particular problem is
overlapping lines.)

The trouble is, I want to draw some graphs. Building a graph drawing
engine is only a secondary goal; the major goal is building the program
that produces the graphs in the first place. So I'm trying to do it
quickly... but I want it to look reasonable. Hmm.
Post a reply to this message
|
|
| |
| |
|
|
|
|
| |
| |
|
|
Invisible a écrit :
> I did take a look at the "dot" tool - but it tends to produce utterly
> horrid graphs. I mean, *astonishingly* bad graphs.

Perhaps it would be wise, before writing such statements, to ensure that
your own tool reaches at least an equivalent quality ;-)

--
Vincent
Post a reply to this message
|
|
| |
| |
|
|
|
|
| |
| |
|
|
Vincent Le Chevalier wrote:
> Invisible a écrit :
>> I did take a look at the "dot" tool - but it tends to produce utterly
>> horrid graphs. I mean, *astonishingly* bad graphs.
>
> Perhaps it would be wise, before writing such statements, to ensure that
> your own tool reaches at least an equivalent quality ;-)

Well, thus far my tool has succeeded in not putting nodes on top of each
other, and so their labels are at least readable. That's an improvement,
if only a small one.
Post a reply to this message
|
|
| |
| |
|
|
|
|
| |
| |
|
|
Invisible a écrit :
> Vincent Le Chevalier wrote:
>> Invisible a écrit :
>>> I did take a look at the "dot" tool - but it tends to produce utterly
>>> horrid graphs. I mean, *astonishingly* bad graphs.
>>
>> Perhaps it would be wise, before writing such statements, to ensure
>> that your own tool reaches at least an equivalent quality ;-)
>
> Well, thus far my tool has succeeded in not putting nodes on top of each
> other, and so their labels are at least readable. That's an improvement,
> if only a small one.

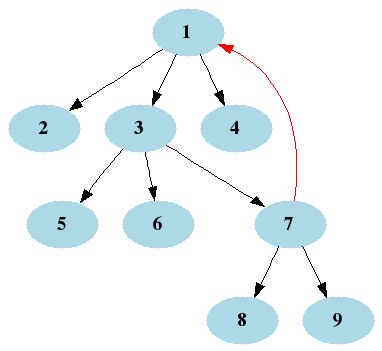
Except I have no such problem with dot...

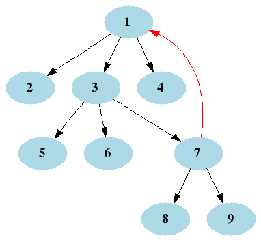
Example:

digraph "" {
node [shape=ellipse, color=lightblue, style=filled, fontname="Times-Bold"]
p1 [label="1"];
p2 [label="2"];
p3 [label="3"];
p4 [label="4"];
p5 [label="5"];
p6 [label="6"];
p7 [label="7"];
p8 [label="8"];
p9 [label="9"];

edge [color=black]
p1 -> p2
p1 -> p3
p1 -> p4
p3 -> p5
p3 -> p6
p3 -> p7
p7 -> p8
p7 -> p9
edge [color=red]
p7 -> p1
}

gives the image attached. Probably not the most terse way since I
adapted it from a computer-generated dot file.

What's wrong?

--
Vincent
Post a reply to this message
Attachments:
Download 'example.png' (4 KB)
Preview of image 'example.png'
|
|
| |
| |
|
|
|
|
| |
| |
|
|
>>> Perhaps it would be wise, before writing such statements, to ensure
>>> that your own tool reaches at least an equivalent quality ;-)
>>
>> Well, thus far my tool has succeeded in not putting nodes on top of
>> each other, and so their labels are at least readable. That's an
>> improvement, if only a small one.
>
> Except I have no such problem with dot...
>
> Example:
>
> digraph "" {
> node [shape=ellipse, color=lightblue, style=filled, fontname="Times-Bold"]
> p1 [label="1"];
> p2 [label="2"];
> p3 [label="3"];
> p4 [label="4"];
> p5 [label="5"];
> p6 [label="6"];
> p7 [label="7"];
> p8 [label="8"];
> p9 [label="9"];
>
> edge [color=black]
> p1 -> p2
> p1 -> p3
> p1 -> p4
> p3 -> p5
> p3 -> p6
> p3 -> p7
> p7 -> p8
> p7 -> p9
> edge [color=red]
> p7 -> p1
> }
>
> gives the image attached. Probably not the most terse way since I
> adapted it from a computer-generated dot file.
>
> What's wrong?

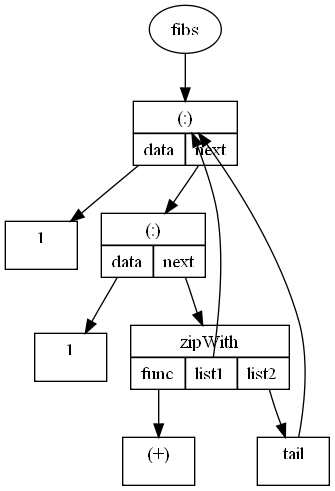
That's interesting. I never managed to get a result to look that nice.
(Although a little AA certainly wouldn't hurt!)

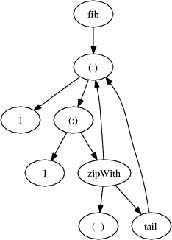
What happens if you try it with this?

digraph ""
{
   n1 [label="fib"]
   n2 [label="(:)"]
   n3 [label="1"]
   n4 [label="(:)"]
   n5 [label="1"]
   n6 [label="zipWith"]
   n7 [label="(+)"]
   n8 [label="tail"]

   n1 -> n2
   n2 -> n3
   n2 -> n4
   n4 -> n5
   n4 -> n6
   n6 -> n7
   n6 -> n2
   n6 -> n8
   n8 -> n2
}

I eventually managed to get this to look half reasonable with my own
tool, but still not great.
Post a reply to this message
|
|
| |
| |
|
|
|
|
| |
| |
|
|
Invisible a écrit :
> (Although a little AA certainly wouldn't hurt!)

Yes, thankfully dot can output vector graphics so that's easy to settle.
Actually maybe the antialiasing in newer versions is better with the
direct png export...

> What happens if you try it with this?

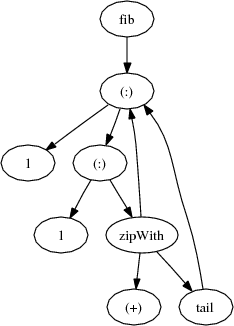
This (antialiased by converting from ps to png with ImageMagick).

--
Vincent
Post a reply to this message
Attachments:
Download 'example.png' (5 KB)
Preview of image 'example.png'
|
|
| |
| |
|
|
|
|
| |
| |
|
|
>> (Although a little AA certainly wouldn't hurt!)
>
> Yes, thankfully dot can output vector graphics so that's easy to settle.
> Actually maybe the antialiasing in newer versions is better with the
> direct png export...

OK, that settles that then.

>> What happens if you try it with this?
>
> This (antialiased by converting from ps to png with ImageMagick).

OK, well that's pretty smooth looking. Certainly neater than what my
program produced.

The only thing I can think of is that maybe last time I tried dot out
while I was trying to do really complex mind maps and the vast number of
nodes and dense interconnections upset the layout algorithm. Certainly
your examples seem to be laid out just fine.

One small issue is that for the graphs I'm interested in, the ordering
of the edges is significant. That is,

   n25 -> n82
   n25 -> n133

means something different to

   n25 -> n133
   n25 -> n82

But dot will of course render them identically. I'm wondering if there's
a way to work round that. Maybe add some smaller nodes to label the
edges? (Presumably you can do that?)
Post a reply to this message
|
|
| |
| |
|
|
|
|
| |
| |
|
|
On 8-4-2009 11:48, Invisible wrote:
> I wrote a program that takes a connection list such as
>
>   [
>     (1, n [b 2, b 3, b 4]),
>     (2, n []),
>     (3, n [b 5, b 6, b 7]),
>     (4, n []),
>     (5, n []),
>     (6, n []),
>     (7, n [b 8, b 9, a 1]),
>     (8, n []),
>     (9, n [])
>   ]
>
> and generates an image such as the one attached.
>
> Trouble is... it's not a very good graphic, is it? :-/
>
> ------------------------------------------------------------------------
>
My first suggestion would be to use a metapost or latex package. Not
sure if that is an option.
Post a reply to this message
|
|
| |
| |
|
|
|
|
| |
| |
|
|
Invisible a écrit :
> One small issue is that for the graphs I'm interested in, the ordering
> of the edges is significant. That is,
>
>   n25 -> n82
>   n25 -> n133
>
> means something different to
>
>   n25 -> n133
>   n25 -> n82
>
> But dot will of course render them identically. I'm wondering if there's
> a way to work round that. Maybe add some smaller nodes to label the
> edges? (Presumably you can do that?)

Oh, you can even add labels to the edges directly withput having to add
a node :-)

If edge order is important apparently adding ordering=out at the graph
level will draw the outgoing edges of each node in the order they are
encountered. Of course this will possibly create more edge
interesections than necessary...

Anyway, I'm not saying that GraphViz can do absolutely anything you
might need. But you should look into it deeper than just "it broke down
the day I fed it an enormous graph with all the options at their default
value" :-D And the documentation seems good enough...

I wonder what your own tool would do with the graphs you tested dot on
originally, by the way ;-)

--
Vincent
Post a reply to this message
|
|
| |
| |
|
|
|
|
| |
| |
|
|
Vincent Le Chevalier wrote:

> Oh, you can even add labels to the edges directly withput having to add
> a node :-)
>
> If edge order is important apparently adding ordering=out at the graph
> level will draw the outgoing edges of each node in the order they are
> encountered. Of course this will possibly create more edge
> interesections than necessary...

That's interesting. I'll have to take a look at that.

> I wonder what your own tool would do with the graphs you tested dot on
> originally, by the way ;-)

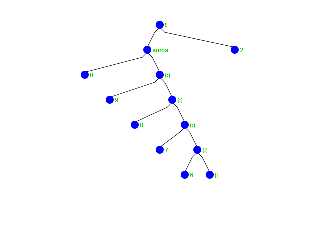
Break horrifyingly. My new tool is designed speicifically for the one
particular graphing problem I'm trying to solve today. I've got it to
work modestly well so far...
Post a reply to this message
Attachments:
Download 'length8.g.png' (3 KB)
Preview of image 'length8.g.png'
|
|
| |
| |
|
|
|
|
| |
| |
|
|
Invisible wrote:

> Break horrifyingly. My new tool is designed speicifically for the one
> particular graphing problem I'm trying to solve today. I've got it to
> work modestly well so far...

LOL! Attached the wrong damn imaged...
Post a reply to this message
Attachments:
Download 'index1.g.png' (10 KB)
Preview of image 'index1.g.png'
|
|
| |
| |
|
|
|
|
| |
| |
|
|
>> Oh, you can even add labels to the edges directly withput having to
>> add a node :-)
>>
>> If edge order is important apparently adding ordering=out at the graph
>> level will draw the outgoing edges of each node in the order they are
>> encountered. Of course this will possibly create more edge
>> interesections than necessary...
>
> That's interesting. I'll have to take a look at that.

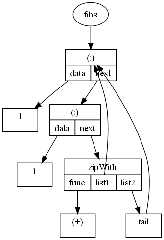
This is the best I've managed to come up with so far using dot. It's
still not perfect, but it's just about readable.

--
http://blog.orphi.me.uk/
http://www.zazzle.com/MathematicalOrchid*
Post a reply to this message
Attachments:
Download 'fibs3.png' (21 KB)
Preview of image 'fibs3.png'
|
|
| |
| |
|
|
|
|
| |
| |
|
|
Invisible wrote:

> OK, well that's pretty smooth looking. Certainly neater than what my
> program produced.
>
> The only thing I can think of is that maybe last time I tried dot out
> while I was trying to do really complex mind maps and the vast number of
> nodes and dense interconnections upset the layout algorithm. Certainly
> your examples seem to be laid out just fine.

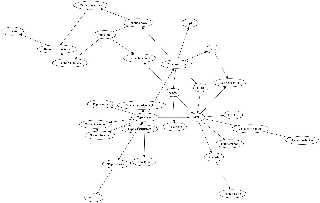
Case in point: see attachment.

It appears that the problem is that neato produces ridiculously bad
layouts. The dot program seems to actually do quite well, generally.

--
http://blog.orphi.me.uk/
http://www.zazzle.com/MathematicalOrchid*
Post a reply to this message
Attachments:
Download 'haskell1.jpg' (110 KB)
Preview of image 'haskell1.jpg'
|
|
| |
| |
|
|
|
|
| |
| |
|
|
Vincent Le Chevalier wrote:
> You might take a look at GraphViz if you haven't done so already:
> http://www.graphviz.org/
>
> I bet you'd find in their papers plenty of ideas to make a better
> rendering... Assuming you want to do it by yourself and not just use
> existing tools.

I'm currently looking through

http://www.graphviz.org/Documentation/TSE93.pdf

which describes the layout algorithm for dot.

Amusingly, many of the algorithmic steps appear to be identical to what
I came up with myself. Specifically, cycles in the graph are broken
internally, nodes are arranged into "ranks" (rows), and then the
positioning algorithm decides where to put them. All of this is
*identical* to my own program. What I don't have is a special
algorithmic stage to rearrange the nodes (since I explicitly don't
*want* their horizontal positioning rearranged for these particular
graphs), and a stage for properly routine the edges (which is why they
keep intersecting things).

It's... encouraging to know that I accidentally managed to get so much
nearly right.

--
http://blog.orphi.me.uk/
http://www.zazzle.com/MathematicalOrchid*
Post a reply to this message
|
|
| |
| |
|
|
|
|
| |
| |
|
|
Orchid XP v8 <voi### [at] dev null> wrote:
> I'm currently looking through
>
> http://www.graphviz.org/Documentation/TSE93.pdf
>
> which describes the layout algorithm for dot.
[snip]
>
> It's... encouraging to know that I accidentally managed to get so much
> nearly right.
Well, algorithmic ideas for many problems are almost always intuitive and
straightforward enough and only implementations differ.
The real question is: is it in Haskell? :) null> wrote:
> I'm currently looking through
>
> http://www.graphviz.org/Documentation/TSE93.pdf
>
> which describes the layout algorithm for dot.
[snip]
>
> It's... encouraging to know that I accidentally managed to get so much
> nearly right.
Well, algorithmic ideas for many problems are almost always intuitive and
straightforward enough and only implementations differ.
The real question is: is it in Haskell? :)
Post a reply to this message
|
|
| |
| |
|
|
|
|
| |
| |
|
|
>> It's... encouraging to know that I accidentally managed to get so much
>> nearly right.
>
> Well, algorithmic ideas for many problems are almost always intuitive and
> straightforward enough and only implementations differ.

I don't know about that.

You have a tree of nodes. You need to place them so they don't overlap.
How do you do that?

It wasn't at all obvious to me how to do that. In fact, my layout
algorithm takes each subtree and draws an invisible box around it, large
enough to contain the entire subtree. This results in many nodes being
shoved too far left or right - much further than actually necessary.
There's probably a way around that, but I haven't found it yet.

> The real question is:  is it in Haskell? :)

Well *duh*! :-P
Post a reply to this message
|
|
| |
| |
|
|
|
|
| |
| |
|
|
Orchid XP v8 wrote:

> Amusingly, many of the algorithmic steps appear to be identical to what
> I came up with myself. What I don't have is a special
> algorithmic stage to rearrange the nodes (since I explicitly don't
> *want* their horizontal positioning rearranged for these particular
> graphs), and a stage for properly routing the edges (which is why they
> keep intersecting things).

Mmm, how ingenious. They add extra "invisible" nodes to each row that an
edge passes through, and then jiggle the invisible nodes around as a
means for deciding how to route the edge.

Of course, they then apply a complex algorithm to decide exactly how to
produce the best possible spline path through the general area reserved.
I doubt I'll go to that much trouble. But I could certainly use
invisible nodes to avoid unecessary intersections...
Post a reply to this message
|
|
| |
| |
|
|
|
|
| |
| |
|
|
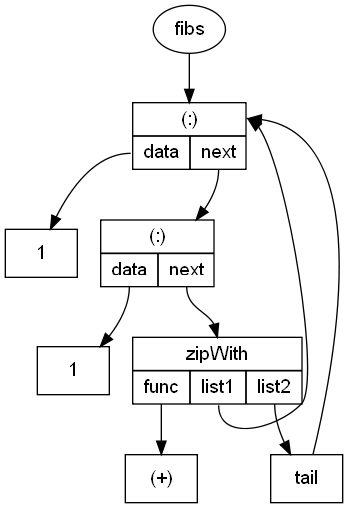
Orchid XP v8 wrote:

> This is the best I've managed to come up with so far using dot. It's
> still not perfect, but it's just about readable.

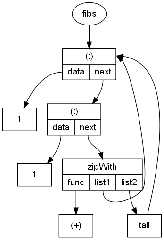
OK, now *that* is interesting... I'm using a newer version of GraphViz
at work, and the same input gives a radically different result:
Post a reply to this message
Attachments:
Download 'fib1.png' (25 KB)
Preview of image 'fib1.png'
|
|
| |
| |
|
|
|
|
| |
| |
|
|
Invisible <voi### [at] devnull> wrote:
> > The real question is:  is it in Haskell? :)
>
> Well *duh*! :-P

That's a cool real-world application for it. :)
Post a reply to this message
|
|
| |
| |
|
|
|
|
| |
| |
|
|
nemesis wrote:
> Orchid XP v8 <voi### [at] devnull> wrote:
>> It's... encouraging to know that I accidentally managed to get so much
>> nearly right.
>
> Well, algorithmic ideas for many problems are almost always intuitive and
> straightforward enough and only implementations differ.

Which is why software patents shouldn't exist.
Post a reply to this message
|
|
| |
| |
|
|
|
|
| |
| |
|
|
Nicolas Alvarez <nic### [at] gmailcom> wrote:
> nemesis wrote:
> > Orchid XP v8 <voi### [at] devnull> wrote:
> >> It's... encouraging to know that I accidentally managed to get so much
> >> nearly right.
> >
> > Well, algorithmic ideas for many problems are almost always intuitive and
> > straightforward enough and only implementations differ.
>
> Which is why software patents shouldn't exist.

Indeed.  You know using xor for operations on screen was once patented, don't
you? :P
Post a reply to this message
|
|
| |
| |
|
|
|
|
| |