|
 |
"Bald Eagle" <cre### [at] netscape net> wrote:
> Hi TOK,
> I'll have to wait until I'm home to access dataduppedings.no/
>
> But in the meantime,
>
> > The attached animation shows 5 x 3 = 15 animated bivariate patches.
> > Each patch is drawn "within" a trivariate (u, v, w) whose control grid consists
> > of 3x3x3 = 27 points.
>
> So, they are quadratic Bezier surfaces?
Yes, rational quadratic Bezier surfaces.
> > Each patch is drawn by varying both the v and w parameters of the trivariate
> > from 0.0 to 1.0, while the animation clock, running from 0.0 to 1.0, is
> > controlling the u parameter.
>
> and then the u parameter gets interpolated between its 3 control points along an
> "orthogonal" quadratic Bezier spline. And I'm assuming that v and w are
> parametric equations of u.
The corners of the patches are influenced by 3 points only - and
the edges of the patches are influenced by 9 points.
But elsewhere in the patches all 27 control points are used in the
calculations (if I have understood this correctly).
And v and w are not parametric equations of u.
Here's some untested and non optimal code that shows the roles of
u, v and w:
#declare QuadraticBlendFns =
array[3] {
function(s) { (1 - s)*(1 - s) },
function(s) { (1 - s)*s },
function(s) { s*s }
}
;
#macro TrivariateQuadraticBezierFunction(CC)
function(_u, _v, _w) {
0.0
#for (K, 0, 2)
#for (J, 0, 2)
#for (I, 0, 2)
+
QuadraticBlendFns[I](_u)
*
QuadraticBlendFns[J](_v)
*
QuadraticBlendFns[K](_w)
*
CC[I][J][K]
#end // for
#end // for
#end // for
}
#end // macro TrivariateQuadraticBezierFunction
> That's pretty cool.
Thank you =)
> Have you thought about geometrically inverting the patches to become a cylinder
> or a cone? :D
I'm not sure what you mean by "inverting the patches".
I have not yet made cones with Bezier patches. But I have made
cylinders. This document shows an example:
https://github.com/t-o-k/Maxima-bezier/blob/main/cylinder_made_with_4_rational_bezier_surfaces_3d.pdf
Here's some more untested code that shows how to use the clock
to "slice" the trivariate functions into bivariate functions.
XX, YY and ZZ are 3x3x3 arrays with the X, Y and coordinates
of the 3x3x3 control points.
#declare TrivariateFnX = TrivariateQuadraticBezierFunction(XX);
#declare TrivariateFnY = TrivariateQuadraticBezierFunction(YY);
#declare TrivariateFnZ = TrivariateQuadraticBezierFunction(ZZ);
#declare U = clock;
#declare BivariateFnX = function(_v, _w) { TrivariateFnX(U, _v, _w) };
#declare BivariateFnY = function(_v, _w) { TrivariateFnY(U, _v, _w) };
#declare BivariateFnZ = function(_v, _w) { TrivariateFnZ(U, _v, _w) };
#declare dV = 1/100;
#declare dW = 1/100;
#declare AnimatedMesh =
mesh {
#declare W0 = 0.0;
#for (K, 1, 100)
#declare W1 = W0 + dW;
#declare V0 = 0.0;
#for (J, 1, 100)
#declare V1 = V0 + dV;
#declare p00 =
<
BivariateFnX(V0, W0),
BivariateFnY(V0, W0),
BivariateFnZ(V0, W0)
>
;
#declare p01 =
<
BivariateFnX(V0, W1),
BivariateFnY(V0, W1),
BivariateFnZ(V0, W1)
>
;
#declare p10 =
<
BivariateFnX(V1, W0),
BivariateFnY(V1, W0),
BivariateFnZ(V1, W0)
>
;
#declare p11 =
<
BivariateFnX(V1, W1),
BivariateFnY(V1, W1),
BivariateFnZ(V1, W1)
>
;
triangle { p00, p10, p11 }
triangle { p11, p01, p00 }
#declare V0 = V1;
#end // for
#declare W0 = W1;
#end // for
}
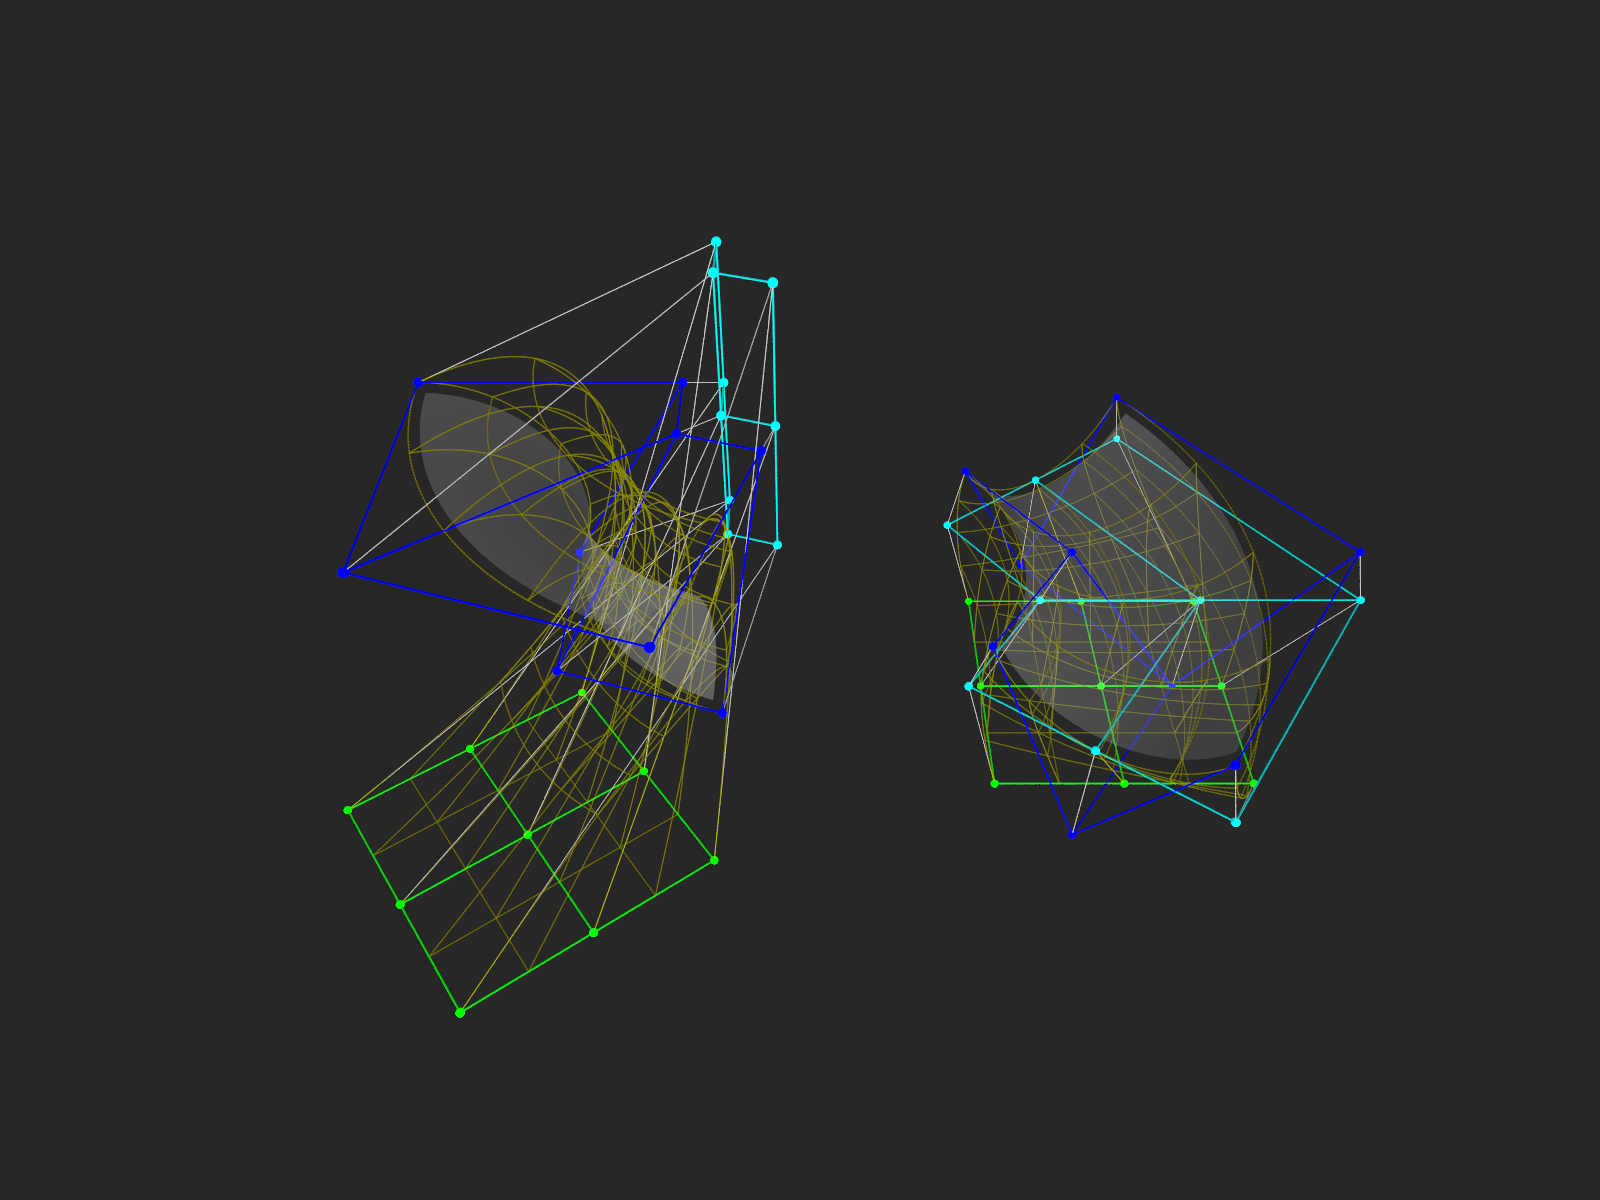
The attached image shows the 3x3x3 = 3x9 = 27 control points for
two of the patches in the animation. Note that the patches do
not get very close to the 9 cyan "intermediate" control points.
--
Tor Olav
http://subcube.com
https://github.com/t-o-k net> wrote:
> Hi TOK,
> I'll have to wait until I'm home to access dataduppedings.no/
>
> But in the meantime,
>
> > The attached animation shows 5 x 3 = 15 animated bivariate patches.
> > Each patch is drawn "within" a trivariate (u, v, w) whose control grid consists
> > of 3x3x3 = 27 points.
>
> So, they are quadratic Bezier surfaces?
Yes, rational quadratic Bezier surfaces.
> > Each patch is drawn by varying both the v and w parameters of the trivariate
> > from 0.0 to 1.0, while the animation clock, running from 0.0 to 1.0, is
> > controlling the u parameter.
>
> and then the u parameter gets interpolated between its 3 control points along an
> "orthogonal" quadratic Bezier spline. And I'm assuming that v and w are
> parametric equations of u.
The corners of the patches are influenced by 3 points only - and
the edges of the patches are influenced by 9 points.
But elsewhere in the patches all 27 control points are used in the
calculations (if I have understood this correctly).
And v and w are not parametric equations of u.
Here's some untested and non optimal code that shows the roles of
u, v and w:
#declare QuadraticBlendFns =
array[3] {
function(s) { (1 - s)*(1 - s) },
function(s) { (1 - s)*s },
function(s) { s*s }
}
;
#macro TrivariateQuadraticBezierFunction(CC)
function(_u, _v, _w) {
0.0
#for (K, 0, 2)
#for (J, 0, 2)
#for (I, 0, 2)
+
QuadraticBlendFns[I](_u)
*
QuadraticBlendFns[J](_v)
*
QuadraticBlendFns[K](_w)
*
CC[I][J][K]
#end // for
#end // for
#end // for
}
#end // macro TrivariateQuadraticBezierFunction
> That's pretty cool.
Thank you =)
> Have you thought about geometrically inverting the patches to become a cylinder
> or a cone? :D
I'm not sure what you mean by "inverting the patches".
I have not yet made cones with Bezier patches. But I have made
cylinders. This document shows an example:
https://github.com/t-o-k/Maxima-bezier/blob/main/cylinder_made_with_4_rational_bezier_surfaces_3d.pdf
Here's some more untested code that shows how to use the clock
to "slice" the trivariate functions into bivariate functions.
XX, YY and ZZ are 3x3x3 arrays with the X, Y and coordinates
of the 3x3x3 control points.
#declare TrivariateFnX = TrivariateQuadraticBezierFunction(XX);
#declare TrivariateFnY = TrivariateQuadraticBezierFunction(YY);
#declare TrivariateFnZ = TrivariateQuadraticBezierFunction(ZZ);
#declare U = clock;
#declare BivariateFnX = function(_v, _w) { TrivariateFnX(U, _v, _w) };
#declare BivariateFnY = function(_v, _w) { TrivariateFnY(U, _v, _w) };
#declare BivariateFnZ = function(_v, _w) { TrivariateFnZ(U, _v, _w) };
#declare dV = 1/100;
#declare dW = 1/100;
#declare AnimatedMesh =
mesh {
#declare W0 = 0.0;
#for (K, 1, 100)
#declare W1 = W0 + dW;
#declare V0 = 0.0;
#for (J, 1, 100)
#declare V1 = V0 + dV;
#declare p00 =
<
BivariateFnX(V0, W0),
BivariateFnY(V0, W0),
BivariateFnZ(V0, W0)
>
;
#declare p01 =
<
BivariateFnX(V0, W1),
BivariateFnY(V0, W1),
BivariateFnZ(V0, W1)
>
;
#declare p10 =
<
BivariateFnX(V1, W0),
BivariateFnY(V1, W0),
BivariateFnZ(V1, W0)
>
;
#declare p11 =
<
BivariateFnX(V1, W1),
BivariateFnY(V1, W1),
BivariateFnZ(V1, W1)
>
;
triangle { p00, p10, p11 }
triangle { p11, p01, p00 }
#declare V0 = V1;
#end // for
#declare W0 = W1;
#end // for
}
The attached image shows the 3x3x3 = 3x9 = 27 control points for
two of the patches in the animation. Note that the patches do
not get very close to the 9 cyan "intermediate" control points.
--
Tor Olav
http://subcube.com
https://github.com/t-o-k
Post a reply to this message
Attachments:
Download 'rational_bezier_control_grids.png' (350 KB)
Preview of image 'rational_bezier_control_grids.png'
|
|