|
 |
So I wanted to check on the size and position of the pattern, given the graphs
in the docs go from -0.5 to 0.5.
The base pattern exists in a cube from <0, 0, 0> to <1, 1, 1>.
Which means it's centered at <0.5, 0.5, 0.5>, and the graph must be showing a
sort of signed axial distance.
But the function NEVER attains a value of 1.
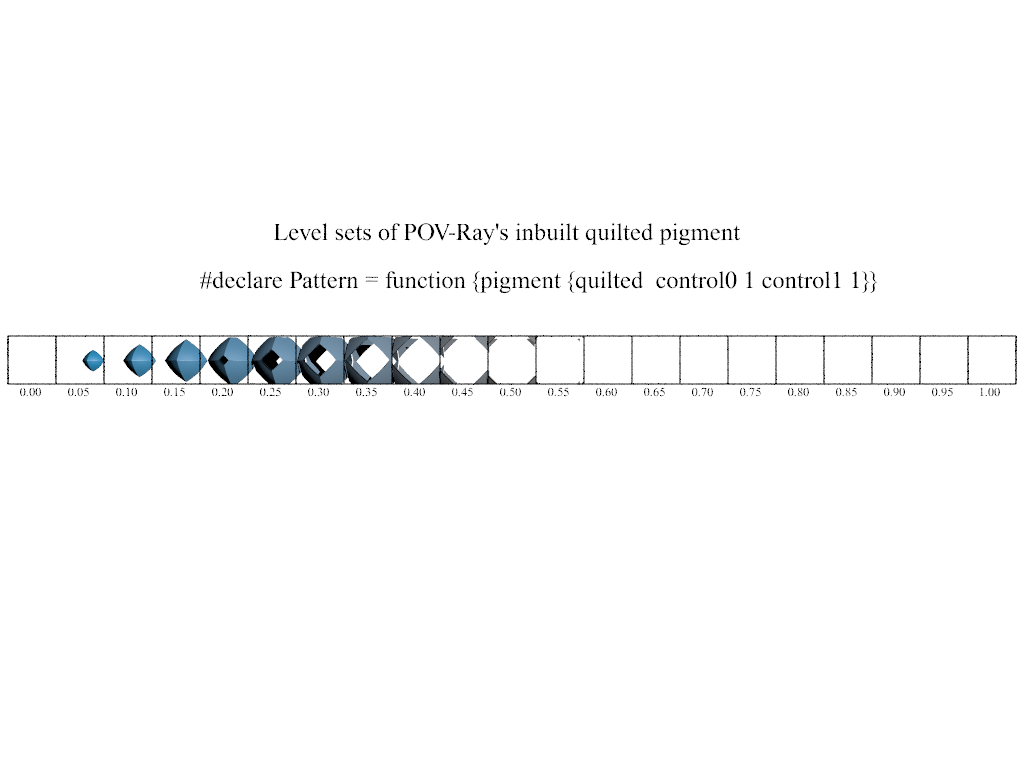
Just to "see it all", I rendered 20 isosurfaces of 'quilted' with thresholds
from 0 to 1.
It just doesn't jive with the graphs showing a function returning values of from
0 to 1 inclusive. Nor with the changing shape of the curves.
(And I did loop through and evaluate all of the c0 and c1 values and just plot
them all on top of one another. Nothing reached 1, nothing stood out as an
S-shaped curve.)
It _does_ agree with the graphs I made showing it topping out at ~0.55.
Lucy... you got some 'splainin' to do....
Post a reply to this message
Attachments:
Download 'quilteddimensions.png' (46 KB)
Preview of image 'quilteddimensions.png'
|
|