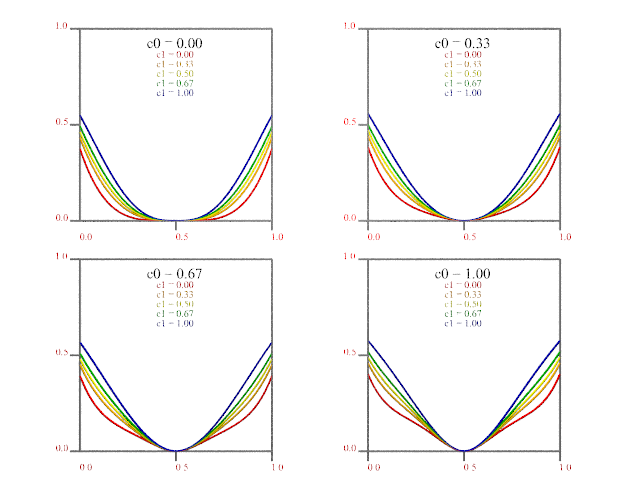
So here's what I'm getting out of
function {pigment {quilted control0 c0 control1 CN[c1]}}
and varying all components of the input vector from 0 to 1 at the same time.
#for (X, 0, 1, 0.01)
#local QX = Q (X, X, X);
plots of QX.x QX.y and QX.z are all the same, and the transmit and filter
components are always 0
So I have no idea where the documentation graphs come from.
I _must_ be doing _something_ wrong....
Post a reply to this message
Attachments:
Download 'quilteddocumentation_38.png' (78 KB)
Preview of image 'quilteddocumentation_38.png'
|