|
 |
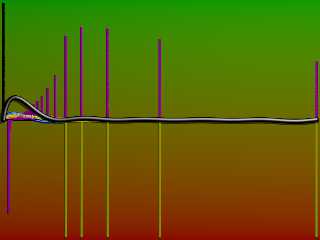
The preceding image clearly shows where the FFT picks out the individual
frequencies contributing to the summed waveform.
Since I used to do nuclear magnetic resonance spectroscopy, we collected raw RF
data from the sample probe, which was a sum of decaying amplitude sinusoidal
signals (like the positive side of a sinc graph) and performed FFT on that to
get the frequencies of the relaxing nuclei.
I modified the code a bit to show how the FFT picks out the primary frequencies
from the data when it's far less obvious where the full-wavelength nodes are.
I still need to automate the pre-FFT data array checking to make sure the data
set is an even power of 2 (or expand it to that, and fill with zeroes), figure
out to perform the inverse operation to get a sinusoid back, and then see if I
can find some code for a 2D FFT that's clear enough for me to follow.
It's been too long since I did any C, C#, C++, Perl, Javascript, etc. to really
be able to translate it to SDL in a timely manner.
I think it would be interesting to see how 1 and 2D Fourier transforms, coupled
with band-pass filtering would change the character of a heightfield use for a
landscape or water surface. "I'm thinking 1D would be something along the lines
of "anisotropic smoothing" and simulate wind-blown sand or waves... Perhaps
I'll see some day.
Post a reply to this message
Attachments:
Download 'fft_test_nmr.png' (56 KB)
Preview of image 'fft_test_nmr.png'

|
 |


![]()