|
|
|
|
|
|
| |
| |
|
|
|
|
| |
| |
|
|
In many tabletop games where a d100 is required, it's a common trick to
throw two (differently-colored) d10's instead, and use one of them
multiplied by 10 and the other as is (because a physical d100 is very
cumbersome and impractical to use). For example, if you throw a white d10
and a black d10, the white could be used as the tens, and the black one
as the ones. The end result is the same as when throwing a d100: An even
distribution. (Many die sets even contain a d10 with multiples of 10
instead of regular 0-9 numbers, for this exact purpose.)
However, suppose that you use a variant of this: Throw two d10's and
then the larger result is always used as the tens, and the other as the
ones. (So for example if you throw a 7 and a 2, then the result is 72,
but if it had been a 2 and a 7, the result would still be 72.)
What is the probability distribution now?
--
- Warp
Post a reply to this message
|
|
| |
| |
|
|
|
|
| |
| |
|
|
I had one today. Given a distribution of things, say peoples' weights, there
will tend to be a normal distribution. I'm sure there are all kinds of
reasonable predictions one can make based on the statistics. For example, I
suppose if you know the weights of 1/10 of a huge population, you can guess what
percentage are over X pounds, etc. You can also probably predict the likelihood
of whether another small set could be a part of the larger set. I'm sure the
math is very good for this.
But does the math predict that there will be a subset with negative weights? Say
one in a quadrillion people will have negative height or weight. We of course
know it's absurd but would the math tell us to wait until we've seen a
quadrillion before dissing the idea. Or does everyone know to use a different
distribution statistic like poisson?
Apologies if this were thread hijacking.
Post a reply to this message
|
|
| |
| |
|
|
|
|
| |
| |
|
|
On 8-2-2010 13:53, Warp wrote:
> In many tabletop games where a d100 is required, it's a common trick to
> throw two (differently-colored) d10's instead, and use one of them
> multiplied by 10 and the other as is (because a physical d100 is very
> cumbersome and impractical to use). For example, if you throw a white d10
> and a black d10, the white could be used as the tens, and the black one
> as the ones. The end result is the same as when throwing a d100: An even
> distribution. (Many die sets even contain a d10 with multiples of 10
> instead of regular 0-9 numbers, for this exact purpose.)
>
> However, suppose that you use a variant of this: Throw two d10's and
> then the larger result is always used as the tens, and the other as the
> ones. (So for example if you throw a 7 and a 2, then the result is 72,
> but if it had been a 2 and a 7, the result would still be 72.)
>
> What is the probability distribution now?
>
any multiple of 11 has a probability of 1/100.
if the numbers are not the same the one where the 10 has a higher value
than the 1 has a probability of 2/100. the rest has probability 0
Integrate if you need a percentile.
Post a reply to this message
|
|
| |
| |
|
|
|
|
| |
| |
|
|
gregjohn <pte### [at] yahoo com> wrote:
> But does the math predict that there will be a subset with negative weights?
AFAIK with a hard lower limit but no upper limit what you get is not a
normal distribution but a poisson distribution:
http://en.wikipedia.org/wiki/Poisson_distribution
which I think has no negative values.
> Apologies if this were thread hijacking.
Maybe the authorities should be called because of this clear threat to
peace and order?-)
--
- Warp com> wrote:
> But does the math predict that there will be a subset with negative weights?
AFAIK with a hard lower limit but no upper limit what you get is not a
normal distribution but a poisson distribution:
http://en.wikipedia.org/wiki/Poisson_distribution
which I think has no negative values.
> Apologies if this were thread hijacking.
Maybe the authorities should be called because of this clear threat to
peace and order?-)
--
- Warp
Post a reply to this message
|
|
| |
| |
|
|
|
|
| |
| |
|
|
andrel <a_l### [at] hotmailcom> wrote:
> any multiple of 11 has a probability of 1/100.
> if the numbers are not the same the one where the 10 has a higher value
> than the 1 has a probability of 2/100. the rest has probability 0
But getting values eg. in the range 10-20 is a lot less probable than
getting values in the range 80-90. This would suggest that the probability
distribution is not very even.
--
- Warp
Post a reply to this message
|
|
| |
| |
|
|
|
|
| |
| |
|
|
Warp wrote:
> http://en.wikipedia.org/wiki/Poisson_distribution
>
> which I think has no negative values.
That is correct:
http://www.xkcd.com/12/
--
http://blog.orphi.me.uk/
http://www.zazzle.com/MathematicalOrchid*
Post a reply to this message
|
|
| |
| |
|
|
|
|
| |
| |
|
|
Warp wrote:
> However, suppose that you use a variant of this: Throw two d10's and
> then the larger result is always used as the tens, and the other as the
> ones.
>
> What is the probability distribution now?
Pr(0) = 1/100
Pr(1) = 0/100
Pr(2) = 0/100
Pr(3) = 0/100
Pr(4) = 0/100
Pr(5) = 0/100
Pr(6) = 0/100
Pr(7) = 0/100
Pr(8) = 0/100
Pr(9) = 0/100
Pr(10) = 2/100
Pr(11) = 1/100
Pr(12) = 0/100
Pr(13) = 0/100
Pr(14) = 0/100
Pr(15) = 0/100
Pr(16) = 0/100
Pr(17) = 0/100
Pr(18) = 0/100
Pr(19) = 0/100
Pr(20) = 2/100
Pr(21) = 2/100
Pr(22) = 1/100
Pr(23) = 0/100
Pr(24) = 0/100
Pr(25) = 0/100
Pr(26) = 0/100
Pr(27) = 0/100
Pr(28) = 0/100
Pr(29) = 0/100
Pr(30) = 2/100
Pr(31) = 2/100
Pr(32) = 2/100
Pr(33) = 1/100
Pr(34) = 0/100
Pr(35) = 0/100
Pr(36) = 0/100
Pr(37) = 0/100
Pr(38) = 0/100
Pr(39) = 0/100
Pr(40) = 2/100
Pr(41) = 2/100
Pr(42) = 2/100
Pr(43) = 2/100
Pr(44) = 1/100
Pr(45) = 0/100
Pr(46) = 0/100
Pr(47) = 0/100
Pr(48) = 0/100
Pr(49) = 0/100
Pr(50) = 2/100
Pr(51) = 2/100
Pr(52) = 2/100
Pr(53) = 2/100
Pr(54) = 2/100
Pr(55) = 1/100
Pr(56) = 0/100
Pr(57) = 0/100
Pr(58) = 0/100
Pr(59) = 0/100
Pr(60) = 2/100
Pr(61) = 2/100
Pr(62) = 2/100
Pr(63) = 2/100
Pr(64) = 2/100
Pr(65) = 2/100
Pr(66) = 1/100
Pr(67) = 0/100
Pr(68) = 0/100
Pr(69) = 0/100
Pr(70) = 2/100
Pr(71) = 2/100
Pr(72) = 2/100
Pr(73) = 2/100
Pr(74) = 2/100
Pr(75) = 2/100
Pr(76) = 2/100
Pr(77) = 1/100
Pr(78) = 0/100
Pr(79) = 0/100
Pr(80) = 2/100
Pr(81) = 2/100
Pr(82) = 2/100
Pr(83) = 2/100
Pr(84) = 2/100
Pr(85) = 2/100
Pr(86) = 2/100
Pr(87) = 2/100
Pr(88) = 1/100
Pr(89) = 0/100
Pr(90) = 2/100
Pr(91) = 2/100
Pr(92) = 2/100
Pr(93) = 2/100
Pr(94) = 2/100
Pr(95) = 2/100
Pr(96) = 2/100
Pr(97) = 2/100
Pr(98) = 2/100
Pr(99) = 1/100
You can compute this quite easily in Haskell:
numbers = do
a <- [0..9]
b <- [0..9]
let x = max a b
let y = min a b
return (10*x + y)
This tries every possible combination of D10 scores, and builds a list
of the resulting score.
histogram =
map (\xs -> (head xs, length xs)) $
group $
sort numbers
This sorts the above list, groups equal elements into little sublist,
and then counts the length of all such sublists, producing a histogram
chart for all scores with non-zero frequency.
With a little extra trickery and some formatting, you can create the
above chart.
--
http://blog.orphi.me.uk/
http://www.zazzle.com/MathematicalOrchid*
Post a reply to this message
|
|
| |
| |
|
|
|
|
| |
| |
|
|
Orchid XP v8 wrote:
> You can compute this quite easily in Haskell:
...and yet, an exhaustive analysis of the data quickly demonstrates that
Andrel was correct in the first place:
Pr(X > Y) = 2/100
Pr(X = Y) = 1/100
Pr(X < Y) = 0/100
--
http://blog.orphi.me.uk/
http://www.zazzle.com/MathematicalOrchid*
Post a reply to this message
|
|
| |
| |
|
|
|
|
| |
| |
|
|
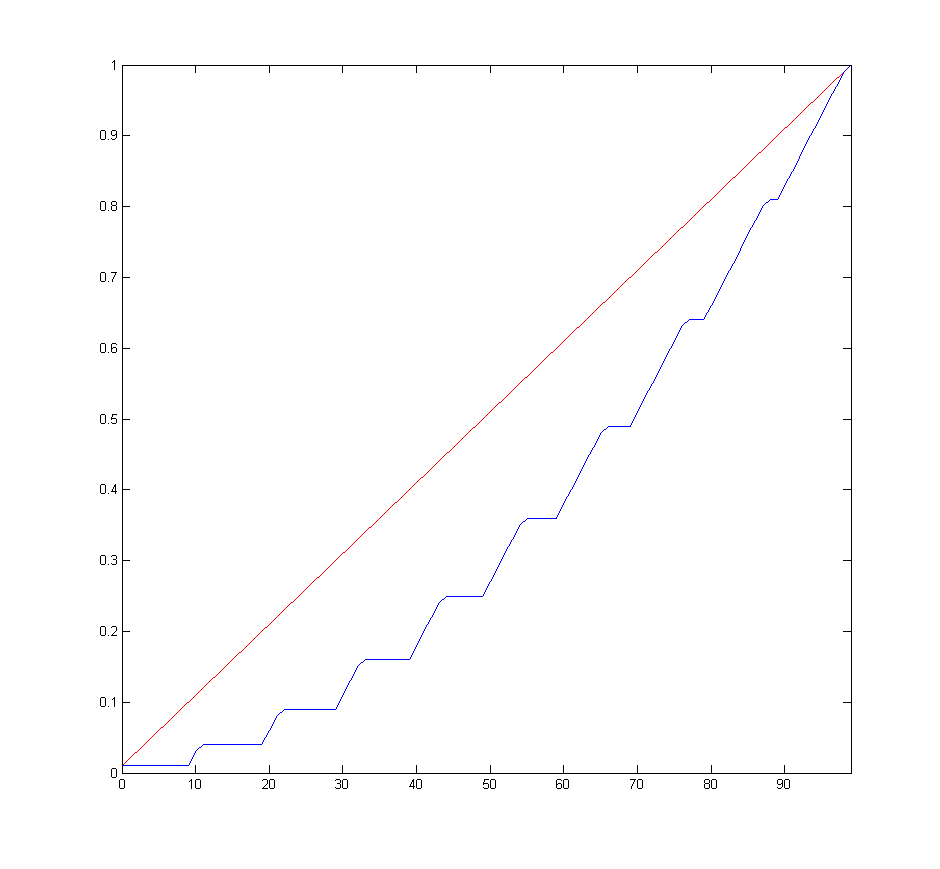
It might be more interesting and intuitive (especially when considering
the original subject matter, ie. throwing dice in a tabletop game) if the
probabilities were divided into ranges. For example, what is the
probability of getting a value in the range 1-10, the range 11-20, the
range 21-30 and so on.
This distribution ought to be uneven.
--
- Warp
Post a reply to this message
|
|
| |
| |
|
|
|
|
| |
| |
|
|
On 8-2-2010 20:04, Orchid XP v8 wrote:
> Warp wrote:
>
>> However, suppose that you use a variant of this: Throw two d10's and
>> then the larger result is always used as the tens, and the other as the
>> ones.
>>
>> What is the probability distribution now?
>
> Pr(0) = 1/100
> Pr(1) = 0/100
> Pr(2) = 0/100
> Pr(3) = 0/100
> Pr(4) = 0/100
> Pr(5) = 0/100
> Pr(6) = 0/100
> Pr(7) = 0/100
> Pr(8) = 0/100
> Pr(9) = 0/100
> Pr(10) = 2/100
> Pr(11) = 1/100
> Pr(12) = 0/100
> Pr(13) = 0/100
> Pr(14) = 0/100
> Pr(15) = 0/100
> Pr(16) = 0/100
> Pr(17) = 0/100
> Pr(18) = 0/100
> Pr(19) = 0/100
> Pr(20) = 2/100
> Pr(21) = 2/100
> Pr(22) = 1/100
> Pr(23) = 0/100
> Pr(24) = 0/100
> Pr(25) = 0/100
> Pr(26) = 0/100
> Pr(27) = 0/100
> Pr(28) = 0/100
> Pr(29) = 0/100
> Pr(30) = 2/100
> Pr(31) = 2/100
> Pr(32) = 2/100
> Pr(33) = 1/100
> Pr(34) = 0/100
> Pr(35) = 0/100
> Pr(36) = 0/100
> Pr(37) = 0/100
> Pr(38) = 0/100
> Pr(39) = 0/100
> Pr(40) = 2/100
> Pr(41) = 2/100
> Pr(42) = 2/100
> Pr(43) = 2/100
> Pr(44) = 1/100
> Pr(45) = 0/100
> Pr(46) = 0/100
> Pr(47) = 0/100
> Pr(48) = 0/100
> Pr(49) = 0/100
> Pr(50) = 2/100
> Pr(51) = 2/100
> Pr(52) = 2/100
> Pr(53) = 2/100
> Pr(54) = 2/100
> Pr(55) = 1/100
> Pr(56) = 0/100
> Pr(57) = 0/100
> Pr(58) = 0/100
> Pr(59) = 0/100
> Pr(60) = 2/100
> Pr(61) = 2/100
> Pr(62) = 2/100
> Pr(63) = 2/100
> Pr(64) = 2/100
> Pr(65) = 2/100
> Pr(66) = 1/100
> Pr(67) = 0/100
> Pr(68) = 0/100
> Pr(69) = 0/100
> Pr(70) = 2/100
> Pr(71) = 2/100
> Pr(72) = 2/100
> Pr(73) = 2/100
> Pr(74) = 2/100
> Pr(75) = 2/100
> Pr(76) = 2/100
> Pr(77) = 1/100
> Pr(78) = 0/100
> Pr(79) = 0/100
> Pr(80) = 2/100
> Pr(81) = 2/100
> Pr(82) = 2/100
> Pr(83) = 2/100
> Pr(84) = 2/100
> Pr(85) = 2/100
> Pr(86) = 2/100
> Pr(87) = 2/100
> Pr(88) = 1/100
> Pr(89) = 0/100
> Pr(90) = 2/100
> Pr(91) = 2/100
> Pr(92) = 2/100
> Pr(93) = 2/100
> Pr(94) = 2/100
> Pr(95) = 2/100
> Pr(96) = 2/100
> Pr(97) = 2/100
> Pr(98) = 2/100
> Pr(99) = 1/100
>
> You can compute this quite easily in Haskell:
>
> numbers = do
> a <- [0..9]
> b <- [0..9]
> let x = max a b
> let y = min a b
> return (10*x + y)
>
> This tries every possible combination of D10 scores, and builds a list
> of the resulting score.
>
> histogram =
> map (\xs -> (head xs, length xs)) $
> group $
> sort numbers
>
> This sorts the above list, groups equal elements into little sublist,
> and then counts the length of all such sublists, producing a histogram
> chart for all scores with non-zero frequency.
>
> With a little extra trickery and some formatting, you can create the
> above chart.
>
Post a reply to this message
Attachments:
Download 'warp.png' (9 KB)
Preview of image 'warp.png'
|
|
| |
| |
|
|
|
|
| |