|
|
|
|
|
|
| |
| |
|
|
|
|
| |
| |
|
|
On 3/2/24 08:02, jr wrote:
> fyi, as of today, there have been visits from 173 different countries.
Anyone from Christmas Island (.cx) ? :-)
Bill P.
Post a reply to this message
|
|
| |
| |
|
|
|
|
| |
| |
|
|
William F Pokorny <ano### [at] anonymous org> wrote:
hi,
> > fyi, as of today, there have been visits from 173 different countries.
> Anyone from Christmas Island (.cx) ? :-)
alas, no. (I'll keep my eyes open though </grin>)
regards, jr. org> wrote:
hi,
> > fyi, as of today, there have been visits from 173 different countries.
> Anyone from Christmas Island (.cx) ? :-)
alas, no. (I'll keep my eyes open though </grin>)
regards, jr.
Post a reply to this message
|
|
| |
| |
|
|
|
|
| |
| |
|
|
hi,
today it is two years exactly since the FL site went back live, even though the
"official" announcement only came in Feb 2024.
Chris (also) provides a log analyser s/ware, and I have daily summaries for the
period. except. I fell ill at year's begin and did not notice "missing data"
until too late; from the 1st to 19th of January the scripted process failed
because I had not done "my bit" following the ususal log rotate, and then had a
senior moment when rebuilding a db. </shrug+sigh>
I had planned to produce a couple of charts from the summaries, and may yet find
"the excuse" to do, but, for now, here's a percentage view of the use
("requests") by continent:
+------------+-------+
| area | pct % |
+------------+-------+
| Africa | 0.35 |
| America N | 38.97 |
| America S | 0.89 |
| Antarctica | 0.00 | [*]
| Asia | 36.82 |
| Europe | 22.75 |
| Oceania | 0.19 |
| unknown | 0.02 |
+------------+-------+
[*] a total of six "visitors" (not counting penguins :-)).
@WFP
the summaries now list 221 countries, but Christmas Island has yet to "dial in".
;-)
by the end of 2024, approx 651k visitors had made a little over 9.2m requests,
530-odd gigabytes of bandwidth total.
for this year, then, we start Jan 20th, plus, recently (the last couple of
months), the usage figures are distorted because the site has become the target
of some concerted "misuse", some "clever" people requesting the same pages, over
and over, from (literally) hundreds of different IP addresses/hosts. with that
in mind, we had, as of this morning, around 2.43m visitors, a little over 20m
requests, approx 631 gigabytes bandwidth used.
I also have an idea how "we", for I certainly would need much help, could put
the geolocation data to good use. a POV-Ray rendered globe, where the
(political) boundaries/borders for each country are 'prism{}' (?) shapes which
can have their heights set according to the frequencies. animated, using
monthly data. any interest ? anyone having suitable (by country) border
"outlines" to hand ?
regards, jr.
Post a reply to this message
|
|
| |
| |
|
|
|
|
| |
| |
|
|
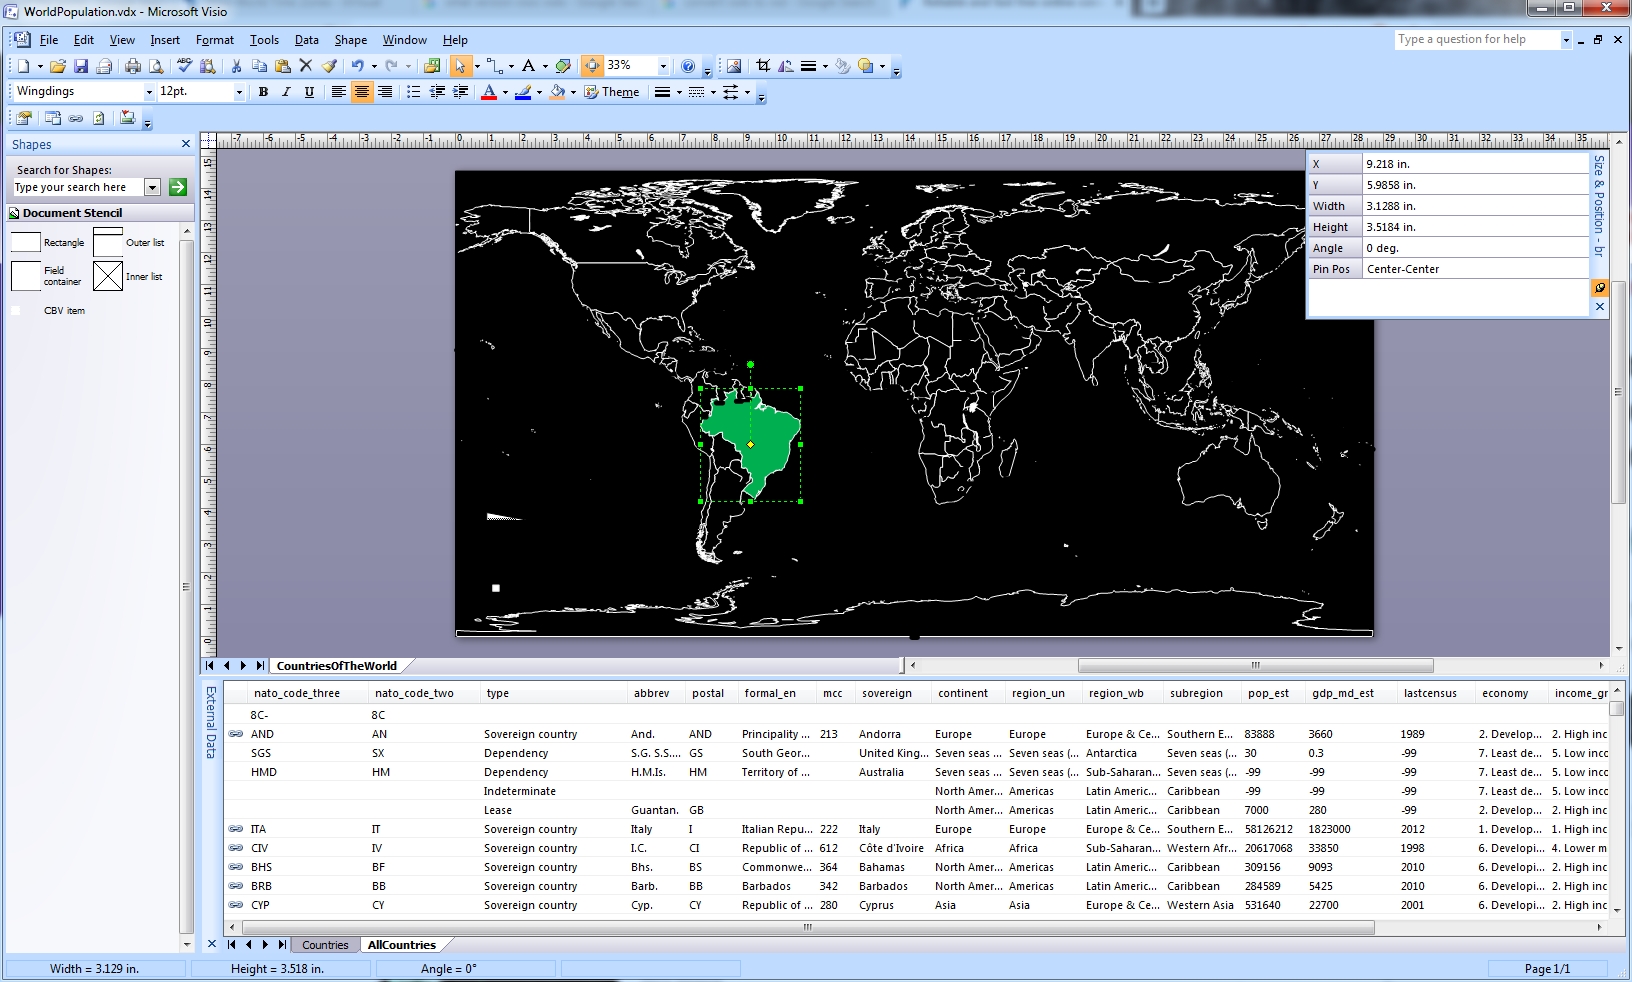
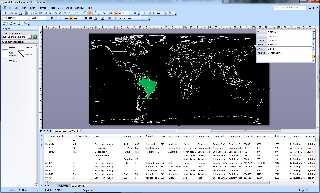
"jr" <cre### [at] gmailcom> wrote:
anyone having suitable (by country) border
> "outlines" to hand ?
https://bvisual.net/2013/08/16/visio-map-of-the-world/
Looks like people use SVG's to create outlines, etc. There must be some sort of
utility or online converter that would allow extraction of outline information.
Presumably each country in an SVG is stored as a "path", that can be converted
to a polygon or prism.
I used an online converter to go from vsdx to vdx and open it in VISIO 2007.
Post a reply to this message
Attachments:
Download 'visio_worldmap.jpg' (628 KB)
Preview of image 'visio_worldmap.jpg'
|
|
| |
| |
|
|
|
|
| |
| |
|
|
On 23/11/2025 16:48, jr wrote:
> I had planned to produce a couple of charts from the summaries, and may yet find
> "the excuse" to do, but, for now, here's a percentage view of the use
> ("requests") by continent:
>
Everything is much more easy, just let GA work for you:
https://analytics.google.com/
I have GA entries in all my sites since they exist.
--
YB
Post a reply to this message
|
|
| |
| |
|
|
|
|
| |
| |
|
|
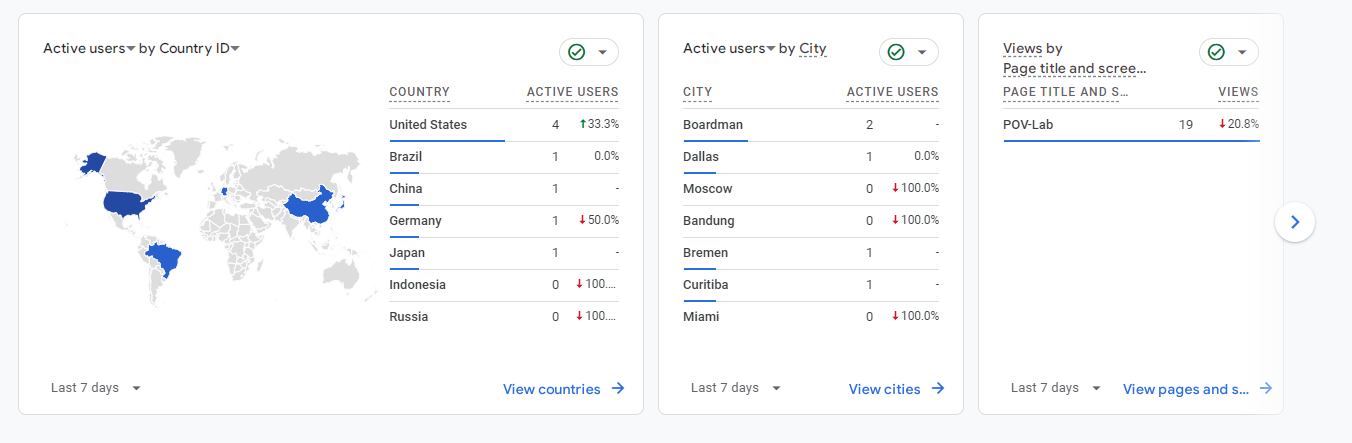
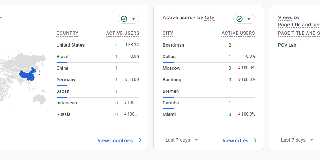
On 24/11/2025 02:40, yesbird wrote:
> I have GA entries in all my sites since they exist.
PS: Charts example attached.
--
YB
Post a reply to this message
Attachments:
Download 'ga.png' (73 KB)
Preview of image 'ga.png'
|
|
| |
| |
|
|
|
|
| |
| |
|
|
hi,
yesbird wrote:
> On 23/11/2025 16:48, jr wrote:
> > I had planned to produce a couple of charts from the summaries, ...
> Everything is much more easy, just let GA work for you: ...
thanks. for the 2D charts I'm looking to use Apache 'echarts' again. any ideas
re a globe, rather than "Mercator"-style ?
regards, jr.
Post a reply to this message
|
|
| |
| |
|
|
|
|
| |
| |
|
|
On 23.11.2025 14:48, jr wrote:
> by the end of 2024, approx 651k visitors had made a little over 9.2m requests,
> 530-odd gigabytes of bandwidth total.
You might want to filter for bots, both legal and illegal (those trying
to click on advertisements). They create a lot of traffic...
Post a reply to this message
|
|
| |
| |
|
|
|
|
| |
| |
|
|
hi,
Thorsten <tho### [at] trfde> wrote:
> On 23.11.2025 14:48, jr wrote:
> > by the end of 2024, approx 651k visitors had made a little over 9.2m requests,
> > 530-odd gigabytes of bandwidth total.
>
> You might want to filter for bots, both legal and illegal (those trying
> to click on advertisements). They create a lot of traffic...
yes, flesh-and-blood visitors are only a part of the "traffic" reported, I sort
of "glossed over" that aspect </shrug+grin>.
regards, jr.
Post a reply to this message
|
|
| |
| |
|
|
|
|
| |
| |
|
|
On 24/11/2025 10:43, jr wrote:
> thanks. for the 2D charts I'm looking to use Apache 'echarts' again. any ideas
> re a globe, rather than "Mercator"-style ?
https://globeletjs.org/
Live example: https://globeletjs.org/examples/mountains/index.html
--
YB
Post a reply to this message
|
|
| |
| |
|
|
|
|
| |