|
 |
On 9/5/23 01:33, ingo wrote:
> William F Pokorny <ano### [at] anonymous org> wrote:
>> I'll play with this stuff more tomorrow.
>>
>
> Hah, I wrote these and the distribution macro's in rand.inc last century. The
> original include file also had macro's and scene for visualizations not unlike
> your images (i.i.r.c. ... last century).
>
> ingo
>
>
>
Ah, I knew you had a big hand in rand.inc, didn't know about (or at
perhaps remember... the histogram macro) :-). Suppose the need has been
around a long time too. I'd for years been using external tools, but a
few days ago I decided to code up something which better aligned with
what I wanted - all POV-Ray.
And Bill W., Thanks again for mentioning the histogram macro - it got me
thinking and I've finished now a couple re-writes and have one slightly
faster than an all SDL one, but both run in a few seconds as a rule. My
updated code will be part of the next, published povr fork tarball.
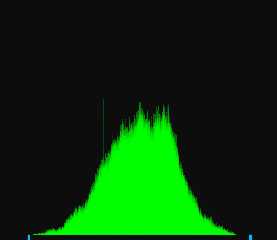
It's interesting what you see on cranking up the bin and sample counts.
Attached an image using 1 million samples and 8192 bins - some of the
quirks start to show (again wrinkles, noise generator 3) - though doubt
they matter too much practically.
Bill P. org> wrote:
>> I'll play with this stuff more tomorrow.
>>
>
> Hah, I wrote these and the distribution macro's in rand.inc last century. The
> original include file also had macro's and scene for visualizations not unlike
> your images (i.i.r.c. ... last century).
>
> ingo
>
>
>
Ah, I knew you had a big hand in rand.inc, didn't know about (or at
perhaps remember... the histogram macro) :-). Suppose the need has been
around a long time too. I'd for years been using external tools, but a
few days ago I decided to code up something which better aligned with
what I wanted - all POV-Ray.
And Bill W., Thanks again for mentioning the histogram macro - it got me
thinking and I've finished now a couple re-writes and have one slightly
faster than an all SDL one, but both run in a few seconds as a rule. My
updated code will be part of the next, published povr fork tarball.
It's interesting what you see on cranking up the bin and sample counts.
Attached an image using 1 million samples and 8192 bins - some of the
quirks start to show (again wrinkles, noise generator 3) - though doubt
they matter too much practically.
Bill P.
Post a reply to this message
Attachments:
Download 'histogram.png' (54 KB)
Preview of image 'histogram.png'
|
|


