|
 |
On 10/15/20 3:13 PM, Bald Eagle wrote:
> William F Pokorny <ano### [at] anonymous org> wrote:
>
...
>
I'll attempt to respond to your recent questions with this post while
rambling too about what I've recently come to understand.
First, I think we missed a mistake in the translation of quilt_cubic. I
believe the correct SDL is:
#declare INV_SQRT_3_4 = 1.154700538; // 1.0/sqrt(3.0/4.0) used in povr
#declare IT = function (T) {1-T}
#declare ITsqr = function (T) {pow(IT (T), 2)}
#declare Tsqr = function (T) {pow(T, 2)}
#declare Tcub = function (T) {pow(T, 3)}
#declare Val0 = function (T, _P1, _P2) {
(
pow(T, 3) +
(3 * T * pow(1-T, 2) * _P1) +
(3 * pow(T,2) * (1-T) * _P2)
)
* INV_SQRT_3_4
}
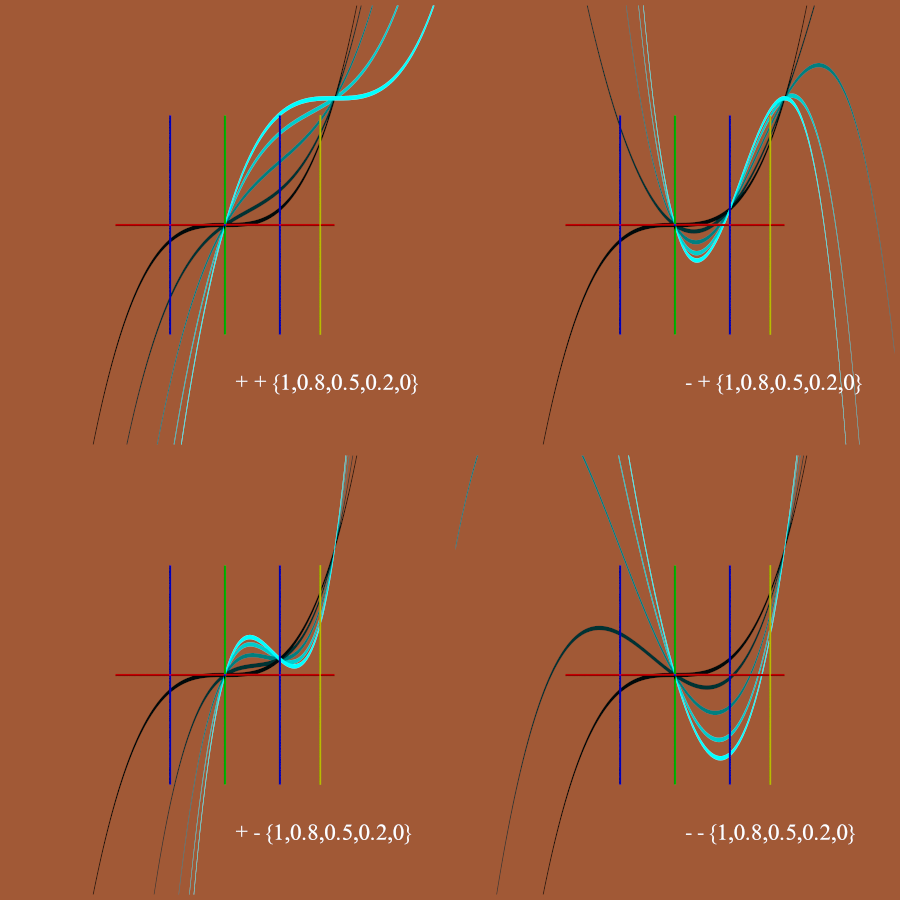
I've attached an image of 4 renders using iosurfaces of the function to
plot. In each plotting results using x at T and using different set
control magnitudes. In each of the four flip the polarity of the control
points as indicated.
Here speaking about the true normal vector perturbation method - ie
normal {quilted..} - what I'm interested in for povr. The old quilted
sent values to quilt_cubic in the range of 0 to 0.867. This is the
yellow vertical line in the plots. My initial re-code is using values
in the range of 0 to 0.5 because it seemed to work well - as do then,
negative control values. Meaning in the current re-code, -1 to 1
control1 and control2 values are OK. Larger magnitudes can be used too,
but results less and less real world like - especially in the negative
direction. (Negative control values 'function' in the current v3.8
quilted too)
At it's best, the old true normal quilted looks a little more
quilted/pillow-y than my current re-code, but the re-code offers much
more stable results. Plus, you can now get other effects with wacko
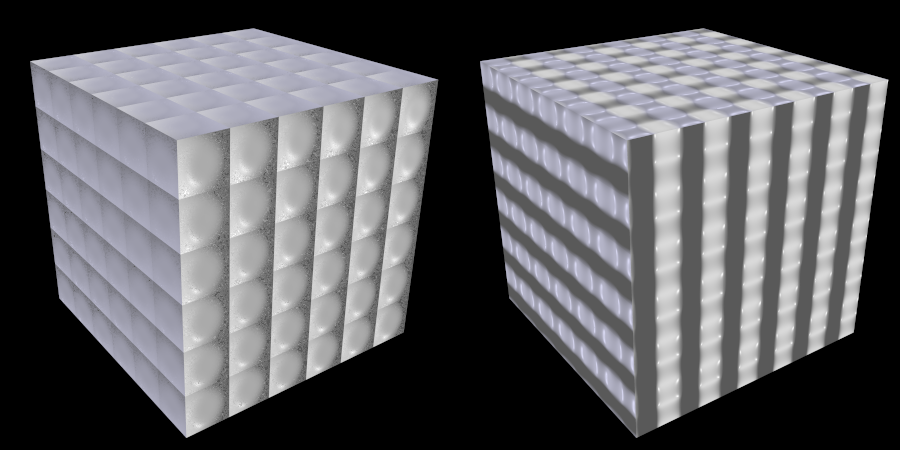
control values. I've attached a second image with a v38 render (noisy)
and a povr render with the control values set to +9.6 and -9.6.
---
On the issue I was seeing with no_bump_scale. I saw what I saw because
of a typo in my original re-code. A typo which caused the +-x axis to
work as usual! Once I stopped trying to internally normalize all 3
dimensions, things work as before for no_bump_scale.
The no_bump_scale turns off the normalization of the incoming surface
normal. Because we are perturbing incoming normals with the true normal
patterns, using the option affects the strength of the perturbation for
all scales not 1 in magnitude. The 'bump_size' value does too - as does
any non-symmetric scaling. The normal perturbation path can be
complicated.
When normals are used in ray direction and color calculations, they are
always normalized to a length of 1.0. In other words, the magnitude of
the normal doesn't matter at this point. Everything we do perturbing
normals has to do with setting the resultant normal direction(a).
(a) - Excepting setting the normal strength to 0 which nulls the normal
effects - though as I write this, I'm unsure what happens with ior
calculations when the normal is zeroed...
Partly by the feature name, I suspect no_bump_scale was first aimed at
bump maps where the depth of the normal at each vertex in patch based
surfaces gets interpolated with the normals on the other corners of the
patch. Some tooling does this in any case.
I'm unsure what happens with triangles and normal interpolation in
POV-Ray with respect to normal magnitudes? Anyone know? When I've played
myself with meshes and setting normals, I've always normalized them.
------- Your questions.
> Don't you just use uv_mapping to fix that?
Yes, that is a way to get what you want for shapes with uv mapping. In
POV-Ray there are often many ways to approach some result. ;-)
> How the normal pattern perturbation works?
My current understanding...
For true normal patterns, essentially, an adder vector is calculated
then weighted by the normal strength / bump_size value (0.5 default)
before it gets added to the incoming surface normal. That incoming
normal may or may not have been normalized depending upon the
no_bump_scale setting.
For "value for map" based normals the values are perturbed and this
affects the pyramid of samples around the surface point and so the
resultant normal direction. I think the no_bump_scale must do nothing
then? - but I've not tested this thought. It is with this form the
normal accuracy default or user setting is used.
> How to explain the -0.5 to 0.5 bottom axis of the plots in the
documentation?
Not sure. Perhaps the values intended to represent the +-magnitudes of
the possible x, y and z offsets from the center of each cube into the
function. So a graph not really a function graph, but something meant to
help users understand quilted? I now lean toward a c0,c1 grid of results
(-1,+1) as a guide over plots of an internal function used in part to
get some final effect.
Bill P. org> wrote:
>
...
>
I'll attempt to respond to your recent questions with this post while
rambling too about what I've recently come to understand.
First, I think we missed a mistake in the translation of quilt_cubic. I
believe the correct SDL is:
#declare INV_SQRT_3_4 = 1.154700538; // 1.0/sqrt(3.0/4.0) used in povr
#declare IT = function (T) {1-T}
#declare ITsqr = function (T) {pow(IT (T), 2)}
#declare Tsqr = function (T) {pow(T, 2)}
#declare Tcub = function (T) {pow(T, 3)}
#declare Val0 = function (T, _P1, _P2) {
(
pow(T, 3) +
(3 * T * pow(1-T, 2) * _P1) +
(3 * pow(T,2) * (1-T) * _P2)
)
* INV_SQRT_3_4
}
I've attached an image of 4 renders using iosurfaces of the function to
plot. In each plotting results using x at T and using different set
control magnitudes. In each of the four flip the polarity of the control
points as indicated.
Here speaking about the true normal vector perturbation method - ie
normal {quilted..} - what I'm interested in for povr. The old quilted
sent values to quilt_cubic in the range of 0 to 0.867. This is the
yellow vertical line in the plots. My initial re-code is using values
in the range of 0 to 0.5 because it seemed to work well - as do then,
negative control values. Meaning in the current re-code, -1 to 1
control1 and control2 values are OK. Larger magnitudes can be used too,
but results less and less real world like - especially in the negative
direction. (Negative control values 'function' in the current v3.8
quilted too)
At it's best, the old true normal quilted looks a little more
quilted/pillow-y than my current re-code, but the re-code offers much
more stable results. Plus, you can now get other effects with wacko
control values. I've attached a second image with a v38 render (noisy)
and a povr render with the control values set to +9.6 and -9.6.
---
On the issue I was seeing with no_bump_scale. I saw what I saw because
of a typo in my original re-code. A typo which caused the +-x axis to
work as usual! Once I stopped trying to internally normalize all 3
dimensions, things work as before for no_bump_scale.
The no_bump_scale turns off the normalization of the incoming surface
normal. Because we are perturbing incoming normals with the true normal
patterns, using the option affects the strength of the perturbation for
all scales not 1 in magnitude. The 'bump_size' value does too - as does
any non-symmetric scaling. The normal perturbation path can be
complicated.
When normals are used in ray direction and color calculations, they are
always normalized to a length of 1.0. In other words, the magnitude of
the normal doesn't matter at this point. Everything we do perturbing
normals has to do with setting the resultant normal direction(a).
(a) - Excepting setting the normal strength to 0 which nulls the normal
effects - though as I write this, I'm unsure what happens with ior
calculations when the normal is zeroed...
Partly by the feature name, I suspect no_bump_scale was first aimed at
bump maps where the depth of the normal at each vertex in patch based
surfaces gets interpolated with the normals on the other corners of the
patch. Some tooling does this in any case.
I'm unsure what happens with triangles and normal interpolation in
POV-Ray with respect to normal magnitudes? Anyone know? When I've played
myself with meshes and setting normals, I've always normalized them.
------- Your questions.
> Don't you just use uv_mapping to fix that?
Yes, that is a way to get what you want for shapes with uv mapping. In
POV-Ray there are often many ways to approach some result. ;-)
> How the normal pattern perturbation works?
My current understanding...
For true normal patterns, essentially, an adder vector is calculated
then weighted by the normal strength / bump_size value (0.5 default)
before it gets added to the incoming surface normal. That incoming
normal may or may not have been normalized depending upon the
no_bump_scale setting.
For "value for map" based normals the values are perturbed and this
affects the pyramid of samples around the surface point and so the
resultant normal direction. I think the no_bump_scale must do nothing
then? - but I've not tested this thought. It is with this form the
normal accuracy default or user setting is used.
> How to explain the -0.5 to 0.5 bottom axis of the plots in the
documentation?
Not sure. Perhaps the values intended to represent the +-magnitudes of
the possible x, y and z offsets from the center of each cube into the
function. So a graph not really a function graph, but something meant to
help users understand quilted? I now lean toward a c0,c1 grid of results
(-1,+1) as a guide over plots of an internal function used in part to
get some final effect.
Bill P.
Post a reply to this message
Attachments:
Download 'cubic_quilt_story.png' (123 KB)
Download 'v38_vs_povr_pn9pt6.png' (224 KB)
Preview of image 'cubic_quilt_story.png'
Preview of image 'v38_vs_povr_pn9pt6.png'
|
|