|
|
|
|
|
|
| |
| |
|
|
|
|
| |
| |
|
|
DESCRIPTION:
POVray experienced a 'bad allocation' error. Is it supposed to stop
parsing/rendering when this happens? It didn't. I had to stop the render
manually.
After I stopped POVray manually, the offending line 624690 was
highlighted in yellow as it is supposed to AFAIK.
Also after stopping POVray, the program wouldn't surrender the allocated
RAM. I had to manually kill the POVray process in order to get the RAM back.
Have I encountered a bug or is this normal behavior?
Mike
POVRAY VERSION:
3.7.0.msvc10.win64
SCREENSHOT:
http://s421.photobucket.com/user/SharkD2161/media/Support/pov_bad_allocation_error_zps5267f909.png.html
SCENE FILES:
http://www.mediafire.com/download/ldh4jq0ndnoczaf/pov_bad_allocation_error_01.zip
SPECS:
Operating System
Microsoft Windows 7 Home Premium 64-bit SP1
CPU
Intel Core 2 Duo E6600 @ 2.40GHz 36 °C
Conroe 65nm Technology
RAM
3.00GB Single-Channel DDR2 @ 333MHz (5-4-4-14)
Motherboard
eMachines EMCP73VT-PM (CPU 1) 26 °C
Graphics
ASUS VS247 (1920x1080@60Hz)
767MB GeForce GTX 460 (nVidia) 43 °C
Hard Drives
466GB Seagate ST350041 8AS SCSI Disk Device (SATA) 35 °C
Optical Drives
HL-DT-ST DVDRAM GH41N SCSI CdRom Device
Audio
High Definition Audio Device
--
http://isometricland.net
---
This email is free from viruses and malware because avast! Antivirus protection is
active.
http://www.avast.com
Post a reply to this message
|
|
| |
| |
|
|
|
|
| |
| |
|
|
I forgot to add that the scene requires LightSysIV.
http://www.ignorancia.org/en/index.php?page=Lightsys
Mike
---
This email is free from viruses and malware because avast! Antivirus protection is
active.
http://www.avast.com
Post a reply to this message
|
|
| |
| |
|
|
|
|
| |
| |
|
|
Am 08.01.2014 00:26, schrieb posfan12:
> DESCRIPTION:
> POVray experienced a 'bad allocation' error. Is it supposed to stop
> parsing/rendering when this happens? It didn't. I had to stop the render
> manually.
It might have been busy de-allocating stuff; it can take quite a while
if a lot of memory had been allocated (and I presume that this was the
case, as "bad allocation" sounds like an out-of-memory situation to me).
> After I stopped POVray manually, the offending line 624690 was
> highlighted in yellow as it is supposed to AFAIK.
>
> Also after stopping POVray, the program wouldn't surrender the allocated
> RAM. I had to manually kill the POVray process in order to get the RAM
> back.
It might either be that manual stopping of the render canceled some
cleanup (which shouldn't be the case), or - again - POV-Ray might have
been busy releasing the RAM but it took longer than you were willing to
wait.
> Have I encountered a bug or is this normal behavior?
Well "normal behavior" it certainly isn't, but it's difficult to tell
whether that's due to a pathologic use case or a bug.
Post a reply to this message
|
|
| |
| |
|
|
|
|
| |
| |
|
|
Here is a log of my most recent attempt at rendering the scene.
10:45 - Started render.
~12:00 - First noticed the "Bad allocation" message. Let the render
continue anyway."Current Memory Usage" indicator hovers around 32MB
despite nearly all my 3GB of RAM being used up.
12:45 - Stopped the render manually. The little tune for ending a render
rings. "Current Memory Usage" starts ticking upward to about 2.5GB.
Toolbar buttons are still grayed out.
1:05 - Most memory has been reclaimed. "Current Memory Usage" indicator
oscillates between ~100MB to ~750MB.
1:30 - The little tune rings again. The toolbar buttons are usable
again. "Current Memory Usage" is still around 175MB.
It takes 45 minutes to reclaim the memory used up by the render? I think
this behavior is very odd.
Mike
---
This email is free from viruses and malware because avast! Antivirus protection is
active.
http://www.avast.com
Post a reply to this message
|
|
| |
| |
|
|
|
|
| |
| |
|
|
Le 08/01/2014 07:44, posfan12 nous fit lire :
> Here is a log of my most recent attempt at rendering the scene.
>
> 10:45 - Started render.
> ~12:00 - First noticed the "Bad allocation" message. Let the render
> continue anyway."Current Memory Usage" indicator hovers around 32MB
> despite nearly all my 3GB of RAM being used up.
> 12:45 - Stopped the render manually. The little tune for ending a
> render rings. "Current Memory Usage" starts ticking upward to about
> 2.5GB. Toolbar buttons are still grayed out.
> 1:05 - Most memory has been reclaimed. "Current Memory Usage"
> indicator oscillates between ~100MB to ~750MB.
> 1:30 - The little tune rings again. The toolbar buttons are usable
> again. "Current Memory Usage" is still around 175MB.
>
>
>
> It takes 45 minutes to reclaim the memory used up by the render? I think
> this behavior is very odd.
>
The scene is fine... if you have at least 17 GB memory, it renders fast
(the parsing is not that long either, yet longer than the render)
(test done on linux, with enough ram)
The top resident memory size in kbytes is 17320752, 17 320 752 kB !
(data from /usr/bin/time -f "%M" ...)
The issue is that your system has only 3GB, so it is going to use
heavily the swap... and that will crawl, whatever the action of aborting
or continuing.
The nice thing is that you use a 64 bits system. A 32 bits system would
have killed your process at the early start.
----------------------------------------------------------------------------
Render Statistics
Image Resolution 800 x 600
----------------------------------------------------------------------------
Pixels: 512705 Samples: 2060397 Smpls/Pxl: 4.02
Rays: 3000442 Saved: 0 Max Level: 2/8
----------------------------------------------------------------------------
Ray->Shape Intersection Tests Succeeded Percentage
----------------------------------------------------------------------------
Box 92985 49203 52.91
Cone/Cylinder 1815147 711682 39.21
CSG Intersection 43585 15866 36.40
CSG Merge 6942 4319 62.22
CSG Union 36339 20023 55.10
Disc 505074 139999 27.72
Mesh 6289760 2675946 42.54
Plane 5388900 2629308 48.79
Sphere 41739 13150 31.51
Torus 188778 121630 64.43
Torus Bound 188778 143738 76.14
Clipping Object 965328 196487 20.35
Bounding Box 393145610 108685620 27.65
----------------------------------------------------------------------------
Roots tested: 143738 eliminated: 56948
Shadow Ray Tests: 2560983 Succeeded: 331457
Shadow Cache Hits: 186477
----------------------------------------------------------------------------
Radiosity samples calculated: 21367 (0.88 %)
discarded due to low quality: 213
retained for re-use: 21154
Radiosity samples reused: 2413884
Radiosity sample rays shot: 427340
Radiosity octree nodes: 3569
Radiosity octree samples/node: 5.93
Radiosity blocks examined: 769436051
Radiosity blocks passed test 0: 769436051 (100.00 %)
Radiosity blocks passed test 1: 125276176 (16.28 %)
Radiosity blocks passed test 2: 86730658 (11.27 %)
Radiosity blocks passed test 3: 29110680 (3.78 %)
Radiosity blocks passed test 4: 23710715 (3.08 %)
Radiosity blocks passed test 5: 22667718 (2.95 %)
Radiosity blocks rejected: 746768333 (97.05 %)
----------------------------------------------------------------------------
Radiosity Depth 0 calculated: 21367 (0.88 %)
Radiosity Depth 0 reused: 2413884
Radiosity Depth 0 rays shot: 427340
----------------------------------------------------------------------------
Radiosity (final) calculated: 19963 (0.82 %)
Radiosity (final) reused: 2413385
Radiosity (final) rays shot: 399260
----------------------------------------------------------------------------
Pass Depth 0 Total
----------------------------------------------------------------------------
1 104 104
2 343 343
3 957 957
Final 19963 19963
----------------------------------------------------------------------------
Total 21367 21367
Weight 0.183
----------------------------------------------------------------------------
----------------------------------------------------------------------------
Render Time:
Photon Time: No photons
Radiosity Time: 0 hours 0 minutes 0 seconds (0.035 seconds)
using 12 thread(s) with 0.191 CPU-seconds total
Trace Time: 0 hours 0 minutes 5 seconds (5.202 seconds)
using 12 thread(s) with 59.732 CPU-seconds total
POV-Ray finished
Post a reply to this message
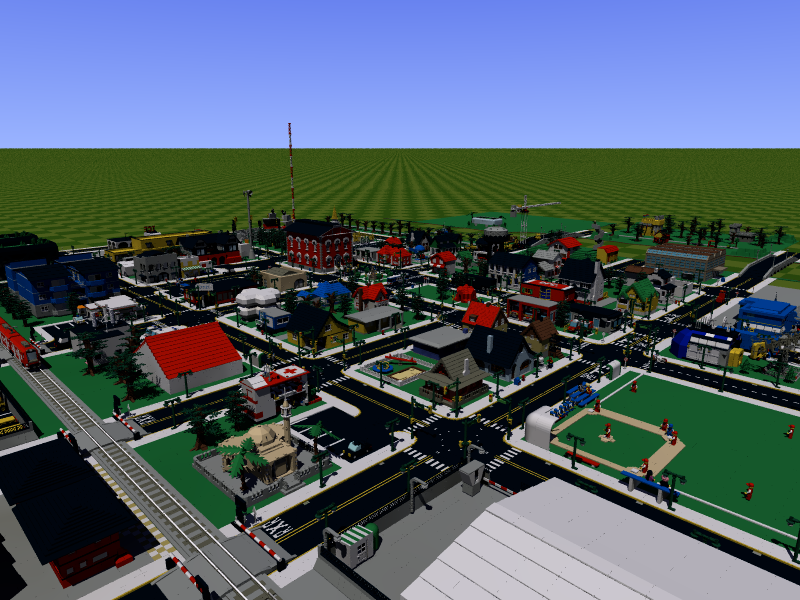
Attachments:
Download 'l3p_datsville_townview.png' (467 KB)
Preview of image 'l3p_datsville_townview.png'
|
|
| |
| |
|
|
|
|
| |
| |
|
|
On 1/11/2014 4:13 AM, Le_Forgeron wrote:
> The scene is fine... if you have at least 17 GB memory, it renders fast
> (the parsing is not that long either, yet longer than the render)
> (test done on linux, with enough ram)
>
> The top resident memory size in kbytes is 17320752, 17 320 752 kB !
> (data from /usr/bin/time -f "%M" ...)
>
> The issue is that your system has only 3GB, so it is going to use
> heavily the swap... and that will crawl, whatever the action of aborting
> or continuing.
>
> The nice thing is that you use a 64 bits system. A 32 bits system would
> have killed your process at the early start.
I'm not worried about the scene. I know other people have rendered it
just fine. My question was in regard to POV-Ray's strange behavior. I.e.
not quitting when encountering a memory allocation error, the end render
WAV sound playing twice instead of once, and the program not
de-allocating my RAM.
You raise some additional points though. How big does my swap file need
to be? I raised it to 40960MB and it _still_ results in a memory
allocation error. Do I need to raise it further?
Mike
---
This email is free from viruses and malware because avast! Antivirus protection is
active.
http://www.avast.com
Post a reply to this message
|
|
| |
| |
|
|
|
|
| |
| |
|
|
On 1/11/2014 7:04 PM, posfan12 wrote:
> I'm not worried about the scene. I know other people have rendered it
> just fine. My question was in regard to POV-Ray's strange behavior. I.e.
> not quitting when encountering a memory allocation error, the end render
> WAV sound playing twice instead of once, and the program not
> de-allocating my RAM.
> You raise some additional points though. How big does my swap file need
> to be? I raised it to 40960MB and it _still_ results in a memory
> allocation error. Do I need to raise it further?
>
>
> Mike
Here's a newer version of the scene. Transparency, reflections,
radiosity etc. are enabled in this one.
Mike
--
http://isometricland.net
---
This email is free from viruses and malware because avast! Antivirus protection is
active.
http://www.avast.com
Post a reply to this message
Attachments:
Download 'datsville_povray_rev385.zip' (2965 KB)
|
|
| |
| |
|
|
|
|
| |
| |
|
|
Le 12/01/2014 01:13, posfan12 nous fit lire :
>
> Here's a newer version of the scene. Transparency, reflections,
> radiosity etc. are enabled in this one.
lg_defs.inc is missing.
Post a reply to this message
|
|
| |
| |
|
|
|
|
| |
| |
|
|
On 1/12/2014 4:52 AM, Le_Forgeron wrote:
> Le 12/01/2014 01:13, posfan12 nous fit lire :
>
>>
>> Here's a newer version of the scene. Transparency, reflections,
>> radiosity etc. are enabled in this one.
>
> lg_defs.inc is missing.
>
>
>
Ah yes, I forgot to mention that you need the LightSysIV library installed:
http://www.ignorancia.org/en/index.php?page=Lightsys
As well as the LGEO parts library:
http://www.digitalbricks.org/lgeo.html
--
http://isometricland.net
---
This email is free from viruses and malware because avast! Antivirus protection is
active.
http://www.avast.com
Post a reply to this message
|
|
| |
| |
|
|
|
|
| |
| |
|
|
I tried rendering the scene again last night this time with two 40GB
swap files on different partitions (I am running out of storage space).
It got to 30001 tokens before I went to bed. 14 hours later when I
checked to see the render progress it was... still at 30001 tokens.
It basically did absolutely nothing overnight. No errors or messages either.
>:(
--
http://isometricland.net
---
This email is free from viruses and malware because avast! Antivirus protection is
active.
http://www.avast.com
Post a reply to this message
|
|
| |
| |
|
|
|
|
| |