|
|
|
|
|
|
| |
| |
|
|
|
|
| |
| |
|
|
OK,
I spent a good part of the weekend working out a prototype to illustrate what
I've been thinking about.
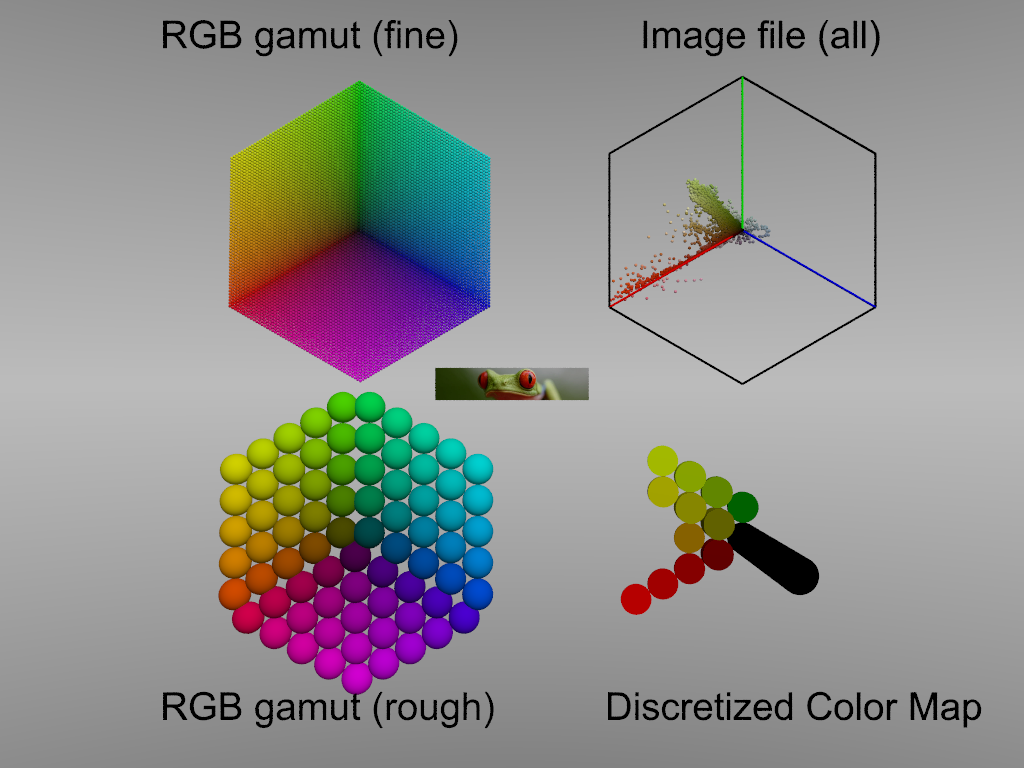
First I needed a way to plot out RGB values so they were "flat", so that there
would be a dimension to extrude the histogram into.
I took a cue from plotting trinary HPLC solvent systems in a triangle, and after
much chasing my tail, somehow stumbled upon an RGB color hexagon.
That worked well enough, so then I needed to discretize it, so that there could
be as few or as many divisions between color value averages as desired.
(I thought about using HSV, but I was too far into it by that time, and I like
that the way this is done uses the "native" RGB values.)
After I got that worked out, it took me pretty much the rest of the day to work
out the processing of the image map RGB values and debug some other unrelated
coding stupidity.
At long last, I have something which, if not complete and as accurate as it
could be, demonstrates the idea, and serves as proof of concept.
I hope I have time to better work this out and make the code better and more
efficient (and faster!)
Post a reply to this message
Attachments:
Download 'hexagonalcolorhistogram.png' (312 KB)
Preview of image 'hexagonalcolorhistogram.png'

|
|
| |
| |
|
|
From: William F Pokorny
Subject: Re: Automated RGB histogram / color map WIP
Date: 20 Mar 2017 08:38:43
Message: <58cfcd53$1@news.povray.org>
|
|
|
| |
| |
|
|
On 03/20/2017 07:45 AM, Bald Eagle wrote:
> OK,
> I spent a good part of the weekend working out a prototype to illustrate what
> I've been thinking about.
>
> First I needed a way to plot out RGB values so they were "flat", so that there
> would be a dimension to extrude the histogram into.
> I took a cue from plotting trinary HPLC solvent systems in a triangle, and after
> much chasing my tail, somehow stumbled upon an RGB color hexagon.
> That worked well enough, so then I needed to discretize it, so that there could
> be as few or as many divisions between color value averages as desired.
>
> (I thought about using HSV, but I was too far into it by that time, and I like
> that the way this is done uses the "native" RGB values.)
>
> After I got that worked out, it took me pretty much the rest of the day to work
> out the processing of the image map RGB values and debug some other unrelated
> coding stupidity.
>
> At long last, I have something which, if not complete and as accurate as it
> could be, demonstrates the idea, and serves as proof of concept.
>
> I hope I have time to better work this out and make the code better and more
> efficient (and faster!)
>
Neat! I like it.
Bill P.
Post a reply to this message
|
|
| |
| |
|
|
|
|
| |
| |
|
|
On 3/20/2017 7:45 AM, Bald Eagle wrote:
> OK,
> I spent a good part of the weekend working out a prototype to illustrate what
> I've been thinking about.
>
> First I needed a way to plot out RGB values so they were "flat", so that there
> would be a dimension to extrude the histogram into.
> I took a cue from plotting trinary HPLC solvent systems in a triangle, and after
> much chasing my tail, somehow stumbled upon an RGB color hexagon.
> That worked well enough, so then I needed to discretize it, so that there could
> be as few or as many divisions between color value averages as desired.
>
> (I thought about using HSV, but I was too far into it by that time, and I like
> that the way this is done uses the "native" RGB values.)
>
> After I got that worked out, it took me pretty much the rest of the day to work
> out the processing of the image map RGB values and debug some other unrelated
> coding stupidity.
>
> At long last, I have something which, if not complete and as accurate as it
> could be, demonstrates the idea, and serves as proof of concept.
>
> I hope I have time to better work this out and make the code better and more
> efficient (and faster!)
>
Pretty cool! But how are you going to show the color white? I don't see
it in the hexagon.
Mike
Post a reply to this message
|
|
| |
| |
|
|
|
|
| |
| |
|
|
Mike Horvath <mik### [at] gmail com> wrote:
> Pretty cool! But how are you going to show the color white? I don't see
> it in the hexagon.
Thus, the "not complete and as accurate as it could be" part.
The whites and grays and all that get "pushed to the rear" and are layers not
visible in the hexagon. I wanted to get a functioning first stab at a COLOR
map, and decided to let that part be for the moment.
Seriously, I _just_ got it to spit out a "proper" histogram around 9pm last
night, and needed to get some sleep before confronting the work ahead of me for
the week.
I will post my horrific code in the scene files section for the interested (and
amusement seekers ;) ). com> wrote:
> Pretty cool! But how are you going to show the color white? I don't see
> it in the hexagon.
Thus, the "not complete and as accurate as it could be" part.
The whites and grays and all that get "pushed to the rear" and are layers not
visible in the hexagon. I wanted to get a functioning first stab at a COLOR
map, and decided to let that part be for the moment.
Seriously, I _just_ got it to spit out a "proper" histogram around 9pm last
night, and needed to get some sleep before confronting the work ahead of me for
the week.
I will post my horrific code in the scene files section for the interested (and
amusement seekers ;) ).
Post a reply to this message
|
|
| |
| |
|
|
|
|
| |
| |
|
|
"Bald Eagle" <cre### [at] netscapenet> wrote:
> Mike Horvath <mik### [at] gmailcom> wrote:
>
> > Pretty cool! But how are you going to show the color white? I don't see
> > it in the hexagon.
>
> Thus, the "not complete and as accurate as it could be" part.
> The whites and grays and all that get "pushed to the rear" and are layers not
> visible in the hexagon. I wanted to get a functioning first stab at a COLOR
> map, and decided to let that part be for the moment.
>
This is really cool. I especially like the idea of being able to choose the
degree of roughness/fineness of the discretising. Nice work, and good
conceptualizing.
Am I guessing correctly that the 'hexagon' shape is actually a 3-D volumetric
cube? Or just flat? If 3-D, then I can visualize what you mean by the grays and
whites being "pushed to the rear" of the cube. That would make sense visually--
the 'center point' of the 2-D hexagon (or 'front corner' of the cube)
representing pure black, and the 'rear corner' of the cube representing pure
white.
Post a reply to this message
|
|
| |
| |
|
|
|
|
| |
| |
|
|
A comment:
Most (or all) color formats are three-dimensional. So you're going to
have trouble fitting all that info into two dimensions. I'm not familiar
with any really good 2D representations.
Mike
Post a reply to this message
|
|
| |
| |
|
|
|
|
| |
| |
|
|
"Kenneth" <kdw### [at] gmailcom> wrote:
> This is really cool. I especially like the idea of being able to choose the
> degree of roughness/fineness of the discretising. Nice work, and good
> conceptualizing.
Thanks! :)
It seems I re-invented HSV and came up with my own way of representing it from
scratch. :|
I was extremely happy when that first histogram popped up after I had enough
"Ohhhhh!...." debugging epiphanies. :D
> Am I guessing correctly that the 'hexagon' shape is actually a 3-D volumetric
> cube? Or just flat? If 3-D, then I can visualize what you mean by the grays and
> whites being "pushed to the rear" of the cube. That would make sense visually--
> the 'center point' of the 2-D hexagon (or 'front corner' of the cube)
> representing pure black, and the 'rear corner' of the cube representing pure
> white.
The hexagons are 3 parallelograms fitted together - I hadn't figured out how to
do the whole gamut in one go. All flat, z=0.
The color values sampled from the picture have the z value determined by some
modification of R+G+B. Black is toward the camera, whites and grays and lighter
color shades toward the rear.
My immediate goal was to home in on the major contributing hues of the image,
since I think it's easier for a user (me) to lighten/darken a color rather than
try to adjust the hue with some unknown amount of R, G, or B.
It's very difficult for me to ... accept ... my rendered procedural
pigments/textures as being accurate representations of the original color -
probably because there is so much other information in the subtle shading and
textural variations of something real, that my brain doesn't like the
approximation I come up with. (Even though a uv-mapped version using a cropped
section of the original photo looks nearly identical)
Perhaps I could find a way to measure the range of saturation of each discrete
area, and vary the shading of the histogram cylinders to suggest that variation.
Not sure how else I'd be able to jam that much info into one 3D space that's
fully visible to the camera.
Post a reply to this message
|
|
| |
| |
|
|
|
|
| |
| |
|
|
Another run: :)
Post a reply to this message
Attachments:
Download 'hexagonalcolorhistogram.png' (312 KB)
Preview of image 'hexagonalcolorhistogram.png'

|
|
| |
| |
|
|
|
|
| |
| |
|
|
"Bald Eagle" <cre### [at] netscapenet> wrote:
> Another run: :)
Grr... Windows drives me insane sometimes.
Post a reply to this message
Attachments:
Download 'hexagonalcolorhistogram2.png' (441 KB)
Preview of image 'hexagonalcolorhistogram2.png'
|
|
| |
| |
|
|
|
|
| |
| |
|
|
I thought this was a great discussion / explanation on the HSV color space, and
how it's derived from RGB.
http://stackoverflow.com/questions/39118528/rgb-to-hsl-conversion
I'll just throw these few links on 3D --> 2D data representation here too...
https://www.quora.com/Whats-the-best-way-to-visualize-high-dimensional-data
https://colah.github.io/posts/2014-10-Visualizing-MNIST/
http://cacm.acm.org/magazines/2010/6/92482-a-tour-through-the-visualization-zoo/fulltext#F1A
Post a reply to this message
|
|
| |
| |
|
|
|
|
| |