 |
 |
|
 |
|
 |
|  |
|  |
|
 |
|
 |
|  |
|  |
|
 |
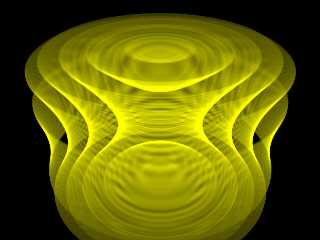
While waiting hours and hours for a nested collection of
semi-transparent isosurfaces to render, in order to show my Calculus
students what was meant by a family of surfaces (hyperboloids in this
case), it suddenly dawned on me that since I wasn't really concerned
with reflections, refractions, interactions or shadows, that this was
quite a bit of overkill, and that I could accomplish the same thing by
using a container filled with "emission" media, defined by a density
function representing my hyperboloids. Besides being hundreds of times
faster, I could also choose a container suited to the surfaces in
question (in this example, a cylinder cut-off makes more natural-looking
hyperboloids.)
This "discovery" may not seem surprising to most POV users, but I hadn't
thought of it before, and it has led to some interesting new families of
surfaces, and new ways (for me) of portraying old ones.
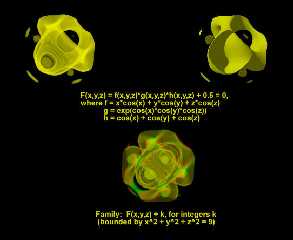
The second image shows a media-drawn "X-Ray" level surface, along side
the isosurface, and below is its family of level surfaces.
Dave Matthews
Post a reply to this message
Attachments:
Download 'hyperboloids001.jpg' (40 KB)
Download 'm&i_002.jpg' (34 KB)
Preview of image 'hyperboloids001.jpg'

Preview of image 'm&i_002.jpg'

|
 |
|  |
|  |
|
 |
|
 |
|  |
|  |
|
 |
Hmm, the first one reminds me of the Grand Stream from the series
Last Exile...^^;
Post a reply to this message
|
 |
|  |
|  |
|
 |
|
 |
|  |
|  |
|
 |
Dave,
You show here very well how Pov-Ray can be used as a wonderful
mathematical visualization tool. Brilliant images too. Would it be
possible to change the color based on the gradient of the function? It
seems like you've got something like that going with the x-ray surface.
I mean for example using blue for shallower slopes and red for higher
slopes on the surface. It might also be interesting to change the
transparency across it.
-Ben
Post a reply to this message
|
 |
|  |
|  |
|
 |
|
 |
|  |
|  |
|
 |
Ben T. Scheele wrote:
>Dave,
> You show here very well how Pov-Ray can be used as a wonderful
>mathematical visualization tool. Brilliant images too.
Thanks.
>Would it be possible to change the color based on the gradient of the >function?
Probably, but I usually have to wait for someone like Mike Williams or
"Sputnik" to come along and show me how ;-)
>It seems like you've got something like that going with the x-ray surface.
>I mean for example using blue for shallower slopes and red for higher
>slopes on the surface.
Actually, that's just a coincidence in this case. I use the function as a
density function, then a simple color map that's black (clear) up to 0.4,
red at 0.4, green at 0.5, red again at 0.6, then black (clear)from 0.6 to
1. So the change in color is really from the change in the paramater:
F(x,y,z) = k. I know what you're suggesting can be done with isosurfaces,
but I'm not sure how to do it with media.
Dave Matthews
Post a reply to this message
|
 |
|  |
|  |
|
 |
|
 |
|  |
|  |
|
 |
Dave, the first image is really beautiful. May I see the code for that?
Where do you teach? I'd love to take your class!
Best,
Dennis
"Dave Matthews" <dma### [at] wr mnwest mnwest mnscu mnscu edu> wrote in message
news:web.3f82ae85bc09b08e10dd5cfd0@news.povray.org...
> Ben T. Scheele wrote:
> >Dave,
> > You show here very well how Pov-Ray can be used as a wonderful
> >mathematical visualization tool. Brilliant images too.
>
> Thanks.
>
> >Would it be possible to change the color based on the gradient of the
>function?
>
> Probably, but I usually have to wait for someone like Mike Williams or
> "Sputnik" to come along and show me how ;-)
>
> >It seems like you've got something like that going with the x-ray
surface.
> >I mean for example using blue for shallower slopes and red for higher
> >slopes on the surface.
>
> Actually, that's just a coincidence in this case. I use the function as a
> density function, then a simple color map that's black (clear) up to 0.4,
> red at 0.4, green at 0.5, red again at 0.6, then black (clear)from 0.6 to
> 1. So the change in color is really from the change in the paramater:
> F(x,y,z) = k. I know what you're suggesting can be done with isosurfaces,
> but I'm not sure how to do it with media.
>
> Dave Matthews
> edu> wrote in message
news:web.3f82ae85bc09b08e10dd5cfd0@news.povray.org...
> Ben T. Scheele wrote:
> >Dave,
> > You show here very well how Pov-Ray can be used as a wonderful
> >mathematical visualization tool. Brilliant images too.
>
> Thanks.
>
> >Would it be possible to change the color based on the gradient of the
>function?
>
> Probably, but I usually have to wait for someone like Mike Williams or
> "Sputnik" to come along and show me how ;-)
>
> >It seems like you've got something like that going with the x-ray
surface.
> >I mean for example using blue for shallower slopes and red for higher
> >slopes on the surface.
>
> Actually, that's just a coincidence in this case. I use the function as a
> density function, then a simple color map that's black (clear) up to 0.4,
> red at 0.4, green at 0.5, red again at 0.6, then black (clear)from 0.6 to
> 1. So the change in color is really from the change in the paramater:
> F(x,y,z) = k. I know what you're suggesting can be done with isosurfaces,
> but I'm not sure how to do it with media.
>
> Dave Matthews
>
Post a reply to this message
|
 |
|  |
|  |
|
 |
|
 |
|  |
|  |
|
 |
Dennis Miller wrote:
>Dave, the first image is really beautiful. May I see the code for that?
>Where do you teach? I'd love to take your class!
>Best,
>Dennis
>
Thanks, Dennis.
I posted the code in PTS-F. You can get some really beautiful images by
playing around with the color_map and the function.
I teach at Minnesota West Community & Technical College, in Worthington, MN,
just a few miles north of Iowa, and a few miles east of South Dakota, atop
the "Buffalo Ridge," reputedly one of the most consistently windy places in
North America (so of course we offer a Wind Power Generation Technician's
Certificate.)
Dave Matthews
Post a reply to this message
|
 |
|  |
|  |
|
 |
|
 |
|  |
|  |
|
 |
Ok, cool. Thanks for the explanation, Dave. I'll check out your scene
file as well.
I'm from Minnesota too, by Lake Minnetonka (a bit west of
Minneapolis), although I'm in Ohio for the fall. I'm actually learning
about some elements of wind power generation, in that I'm working with
composite materials and reading about their applications in wind turbine
blades. It's cool stuff.
Yeah, I also wish I could have had a teacher who put so much work
into their examples. It's kind of sad watching them try futilely to
draw such things on a blackboard.
-Ben
"Dave Matthews" <dma### [at] wr mnwest mnwest mnscu mnscu edu> wrote in message
news:web.3f82d9fbbc09b08e10dd5cfd0@news.povray.org...
> Dennis Miller wrote:
> >Dave, the first image is really beautiful. May I see the code for
that?
> >Where do you teach? I'd love to take your class!
> >Best,
> >Dennis
> >
> Thanks, Dennis.
>
> I posted the code in PTS-F. You can get some really beautiful images
by
> playing around with the color_map and the function.
>
> I teach at Minnesota West Community & Technical College, in
Worthington, MN,
> just a few miles north of Iowa, and a few miles east of South Dakota,
atop
> the "Buffalo Ridge," reputedly one of the most consistently windy
places in
> North America (so of course we offer a Wind Power Generation
Technician's
> Certificate.)
>
> Dave Matthews
> edu> wrote in message
news:web.3f82d9fbbc09b08e10dd5cfd0@news.povray.org...
> Dennis Miller wrote:
> >Dave, the first image is really beautiful. May I see the code for
that?
> >Where do you teach? I'd love to take your class!
> >Best,
> >Dennis
> >
> Thanks, Dennis.
>
> I posted the code in PTS-F. You can get some really beautiful images
by
> playing around with the color_map and the function.
>
> I teach at Minnesota West Community & Technical College, in
Worthington, MN,
> just a few miles north of Iowa, and a few miles east of South Dakota,
atop
> the "Buffalo Ridge," reputedly one of the most consistently windy
places in
> North America (so of course we offer a Wind Power Generation
Technician's
> Certificate.)
>
> Dave Matthews
>
Post a reply to this message
|
 |
|  |
|  |
|
 |
|
 |
|  |
|  |
|
 |
In article <web.3f82ae85bc09b08e10dd5cfd0@news.povray.org>,
"Dave Matthews" <dma### [at] wr mnwest mnwest mnscu mnscu edu> wrote:
> >Would it be possible to change the color based on the gradient of the
> >>function?
>
> Probably, but I usually have to wait for someone like Mike Williams or
> "Sputnik" to come along and show me how ;-)
Well, it would be simple enough, just use the fn_Gradient() macro in
math.inc. It will be quite a bit slower to evaluate, though. Something
more interesting would be to use gradient in each axis for the
respective color component: x gradient for red, y gradient for green,
and z gradient for blue. This should actually be a bit faster...not to
mention more colorful.
--
Christopher James Huff <cja### [at] earthlink edu> wrote:
> >Would it be possible to change the color based on the gradient of the
> >>function?
>
> Probably, but I usually have to wait for someone like Mike Williams or
> "Sputnik" to come along and show me how ;-)
Well, it would be simple enough, just use the fn_Gradient() macro in
math.inc. It will be quite a bit slower to evaluate, though. Something
more interesting would be to use gradient in each axis for the
respective color component: x gradient for red, y gradient for green,
and z gradient for blue. This should actually be a bit faster...not to
mention more colorful.
--
Christopher James Huff <cja### [at] earthlink net>
http://home.earthlink.net/~cjameshuff/
POV-Ray TAG: chr### [at] tag net>
http://home.earthlink.net/~cjameshuff/
POV-Ray TAG: chr### [at] tag povray povray org
http://tag.povray.org/ org
http://tag.povray.org/
Post a reply to this message
|
 |
|  |
|  |
|
 |
|
 |
|  |
|
 |


![]()