So here's the latest development in the visualization of the plate.
Surfing around Paul Nylander's pages helped me stretch my brain and get me back
on the proper track.
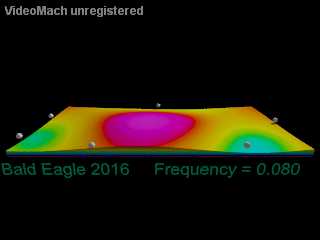
The "data" is all cosine waves that are ballparked to simulate the actual
vibration data, since the isosurface needs the whole wave to plot out the
interference patterns.
100 frames, the height of the flexing ranges from blue to purple.
Took about 40 min to render all the frames.
I'll leave it like for now until I get a few other things worked out - like the
discombobulated Bezier patches and the spline interpolation.
Post a reply to this message
Attachments:
Download 'side_view.gif' (992 KB)
Preview of image 'side_view.gif'
|


