Le 08/01/2014 07:44, posfan12 nous fit lire :
> Here is a log of my most recent attempt at rendering the scene.
>
> 10:45 - Started render.
> ~12:00 - First noticed the "Bad allocation" message. Let the render
> continue anyway."Current Memory Usage" indicator hovers around 32MB
> despite nearly all my 3GB of RAM being used up.
> 12:45 - Stopped the render manually. The little tune for ending a
> render rings. "Current Memory Usage" starts ticking upward to about
> 2.5GB. Toolbar buttons are still grayed out.
> 1:05 - Most memory has been reclaimed. "Current Memory Usage"
> indicator oscillates between ~100MB to ~750MB.
> 1:30 - The little tune rings again. The toolbar buttons are usable
> again. "Current Memory Usage" is still around 175MB.
>
>
>
> It takes 45 minutes to reclaim the memory used up by the render? I think
> this behavior is very odd.
>
The scene is fine... if you have at least 17 GB memory, it renders fast
(the parsing is not that long either, yet longer than the render)
(test done on linux, with enough ram)
The top resident memory size in kbytes is 17320752, 17 320 752 kB !
(data from /usr/bin/time -f "%M" ...)
The issue is that your system has only 3GB, so it is going to use
heavily the swap... and that will crawl, whatever the action of aborting
or continuing.
The nice thing is that you use a 64 bits system. A 32 bits system would
have killed your process at the early start.
----------------------------------------------------------------------------
Render Statistics
Image Resolution 800 x 600
----------------------------------------------------------------------------
Pixels: 512705 Samples: 2060397 Smpls/Pxl: 4.02
Rays: 3000442 Saved: 0 Max Level: 2/8
----------------------------------------------------------------------------
Ray->Shape Intersection Tests Succeeded Percentage
----------------------------------------------------------------------------
Box 92985 49203 52.91
Cone/Cylinder 1815147 711682 39.21
CSG Intersection 43585 15866 36.40
CSG Merge 6942 4319 62.22
CSG Union 36339 20023 55.10
Disc 505074 139999 27.72
Mesh 6289760 2675946 42.54
Plane 5388900 2629308 48.79
Sphere 41739 13150 31.51
Torus 188778 121630 64.43
Torus Bound 188778 143738 76.14
Clipping Object 965328 196487 20.35
Bounding Box 393145610 108685620 27.65
----------------------------------------------------------------------------
Roots tested: 143738 eliminated: 56948
Shadow Ray Tests: 2560983 Succeeded: 331457
Shadow Cache Hits: 186477
----------------------------------------------------------------------------
Radiosity samples calculated: 21367 (0.88 %)
discarded due to low quality: 213
retained for re-use: 21154
Radiosity samples reused: 2413884
Radiosity sample rays shot: 427340
Radiosity octree nodes: 3569
Radiosity octree samples/node: 5.93
Radiosity blocks examined: 769436051
Radiosity blocks passed test 0: 769436051 (100.00 %)
Radiosity blocks passed test 1: 125276176 (16.28 %)
Radiosity blocks passed test 2: 86730658 (11.27 %)
Radiosity blocks passed test 3: 29110680 (3.78 %)
Radiosity blocks passed test 4: 23710715 (3.08 %)
Radiosity blocks passed test 5: 22667718 (2.95 %)
Radiosity blocks rejected: 746768333 (97.05 %)
----------------------------------------------------------------------------
Radiosity Depth 0 calculated: 21367 (0.88 %)
Radiosity Depth 0 reused: 2413884
Radiosity Depth 0 rays shot: 427340
----------------------------------------------------------------------------
Radiosity (final) calculated: 19963 (0.82 %)
Radiosity (final) reused: 2413385
Radiosity (final) rays shot: 399260
----------------------------------------------------------------------------
Pass Depth 0 Total
----------------------------------------------------------------------------
1 104 104
2 343 343
3 957 957
Final 19963 19963
----------------------------------------------------------------------------
Total 21367 21367
Weight 0.183
----------------------------------------------------------------------------
----------------------------------------------------------------------------
Render Time:
Photon Time: No photons
Radiosity Time: 0 hours 0 minutes 0 seconds (0.035 seconds)
using 12 thread(s) with 0.191 CPU-seconds total
Trace Time: 0 hours 0 minutes 5 seconds (5.202 seconds)
using 12 thread(s) with 59.732 CPU-seconds total
POV-Ray finished
Post a reply to this message
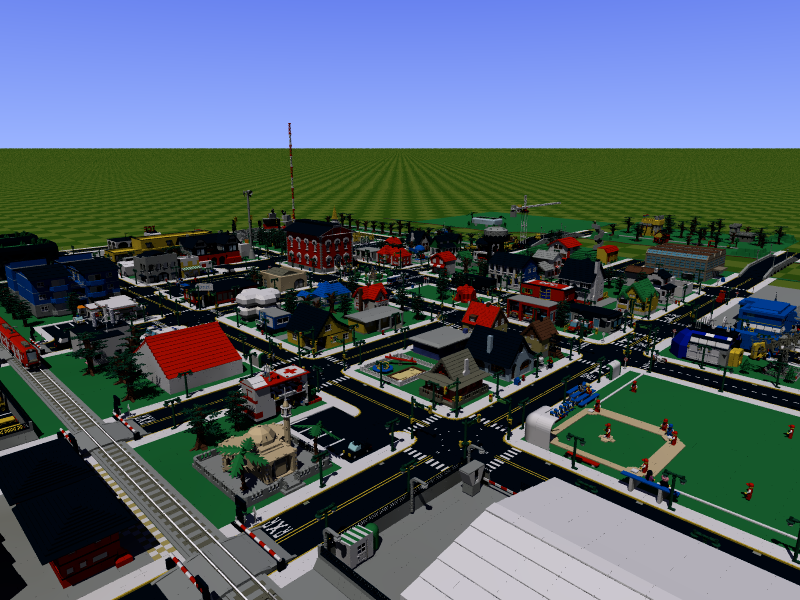
Attachments:
Download 'l3p_datsville_townview.png' (467 KB)
Preview of image 'l3p_datsville_townview.png'
|