|
 |
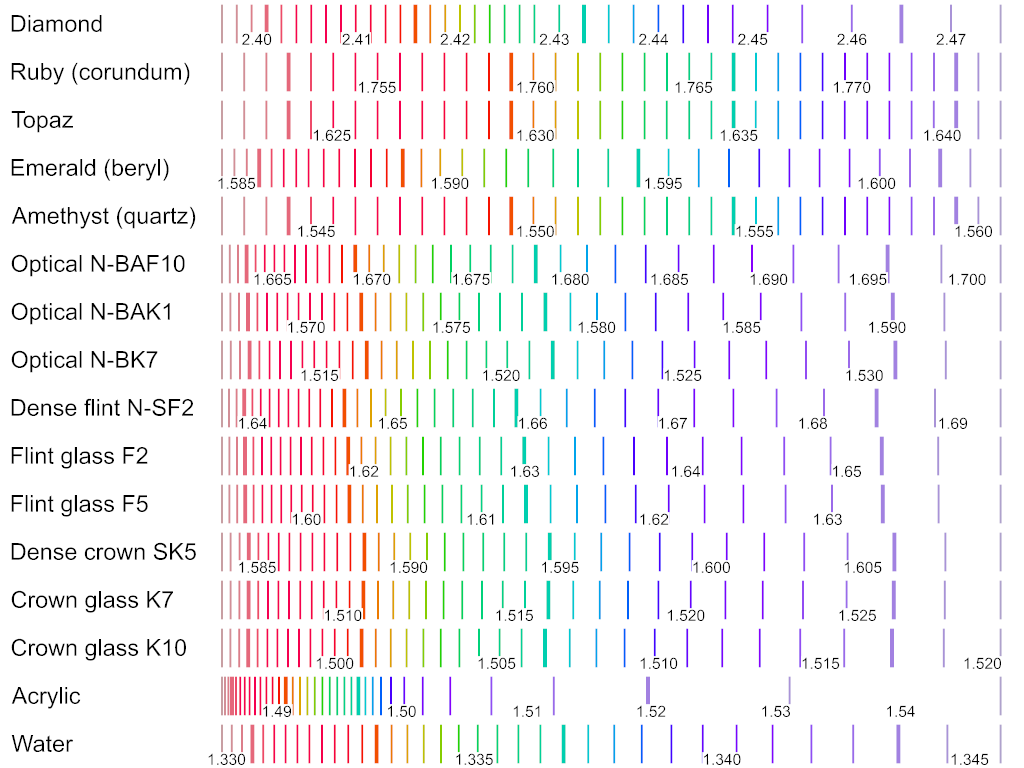
Image srdispersion.png gives a visual impression of the non-linearity of
refractive index with respect to wavelength. The thicker lines
represent 700, 600, 500, and 400 nanometers, left to right.
Corundum (IOR_Ruby), topaz (IOR_Topaz), and quartz (IOR_Amethyst) have a
suspicious regularity to them. I suspect Ive was working with
incomplete data for these. Does anyone have better data?
Note that IOR_Sapphire in spectral_minerals.inc has dodgy IORs for 380
and 390 nm. These wavelengths are nearly invisible to the human eye;
but if they are important to you, then use M_Gem (D_Sapphire, IOR_Ruby,
fade_distance) for sapphire instead of M_Sapphire, as ruby and sapphire
are essentially the same mineral, differing only by their impurities.
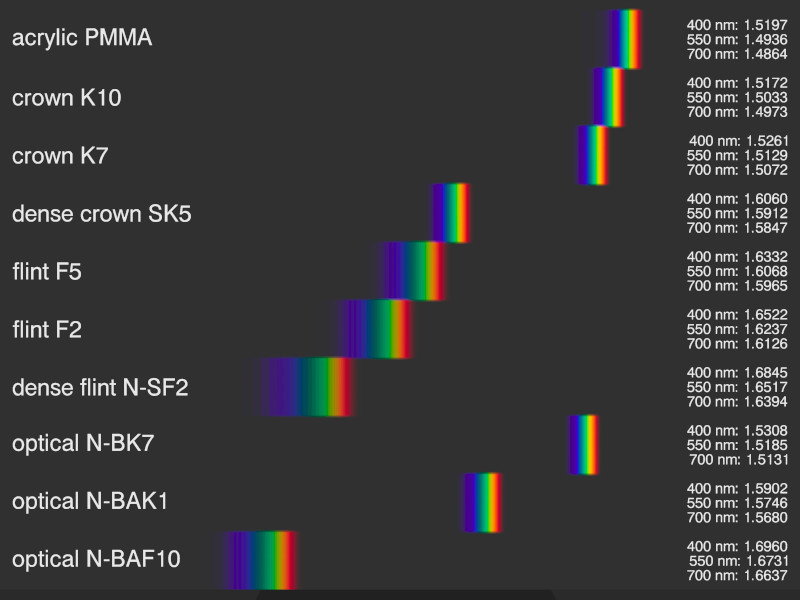
Image glass_survey.jpg is a render of the spectra of the glass materials
in SpectralRender.
Post a reply to this message
Attachments:
Download 'srdispersion.png' (111 KB)
Download 'glass_survey.jpg' (75 KB)
Preview of image 'srdispersion.png'
Preview of image 'glass_survey.jpg'
|
|